Understanding industry-specific compensation trends has always been a way for compensation professionals to remain forward-looking and proactive as it pertains to developing competitive compensation packages. Government contractors navigate a compensation environment that is highly regulated, auditable, and risk-sensitive, making staying knowledgeable of current pay practices and trends a priority for compensation planning. This particularly becomes critical for government contractors as informed pay decisions sit at the intersection of cost control, talent strategy, and risk management.
From building competitive and defensible labor rates for government proposals to confidently passing Defense Contract Audit Agency (DCAA) and Defense Contract Management Agency (DCMA) audits, insight into industry dynamics and trends sets government contractors in a better position for success. In ERI’s recent webinar on 2026 Compensation Trends for Government Contractors, Jonas Johnson, Ph.D., took a closer look at these trends and the shifting market forces that ultimately influence compensation management for government contractors. Beginning September 2025, data that have been historically available have become unavailable. Thus, the findings in this webinar are based on the current economic environment, specifically looking at the trajectory of compensation growth.
Current Workforce Growth
Three sectors were the focus of this webinar: defense, information technology, and health care. All jobs in the United States experienced growth at the average of 2.12% in 2025. In 2025, jobs for defense contractors grew by 2.70%, while jobs for health care contractors grew by 2.27%, meaning both sectors experienced higher job growth than the national average. Alternatively, jobs for information technology contractors lagged behind the national average with job growth of 1.41%.
However, all numbers are down from the historic job growth average of 3% on a year-to-year basis. For instance, in 2023, job growth for defense, health care, and information technology contractors were 4.50%, 4.11%, and 4.76%, respectively, with the U.S. national growth average at 4.12%. All three sectors experienced a drop in job growth from 2023 with numbers lower than what is to be expected on a long-term moving average. Despite some areas outperforming the national average, the trend among all contractors and organizations throughout the economy points towards a decrease in compensation growth.
Labor Market – Job Postings
According to an article from Indeed, all contractor jobs since January 2025 have been down by 15%, with all job postings in that same period down by 0.60%.1 In terms of recruitment, government contractors are not currently recruiting at the same rate as other organizations in the economy. This leads to the inference that there is slower compensation growth, suggesting a weakening labor market that impacts certain sectors more than others (e.g., information technology).
Openings, Hires, and Quits
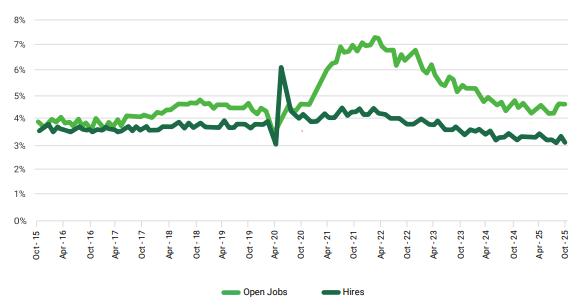
In terms of the open economy, the open jobs rate is currently 4.6%, up from 4.3% in the last quarter but below the 10-year average of 4.9%. Hires are at 3.2%, down from 3.3% in the last quarter. Despite the surges due to seasonal hiring, the overall trend points toward consistent drops in actual hires. Quits dropped to 1.8%, down from 2.2% in the last quarter.
As of September 2025, the reported unemployment rate is at 4.4%, close to full employment. (Generally, full employment falls around 4%.) Despite significant movement in the labor market since September 2025, official data have yet to be released. According to ADP, October saw an addition of 47,000 jobs. However, November lost 32,000 jobs, resulting in a net gain of 15,000 jobs over October and November.2 Now, the question comes down to how many people are entering the workforce on a monthly basis.
Based on the Federal Reserve of St. Louis, 153,000 jobs per month must be added to the economy in order to maintain a consistent unemployment rate and break even with the current unemployment rate.3 This suggests that the reported numbers are not consistent with the current unemployment rate, with the actual unemployment rate being possibly higher than the reported 4.4%.
Moreover, beginning October 2020, there has been a growing gap between open jobs and hires, demonstrating a structural change in patterns. This could be due to multiple factors, such as “ghost postings,” in which postings are intended to be unfulfilled, an inconsistent distribution of employees looking for work, or a limited number of skilled candidates in a given area for hire.
Inflation
As of September 2025, inflation is currently at 3%, and 10-year inflation is at 3.1%. With the Federal Reserve’s target of 2% for inflation, the current rate is higher than what is desirable within the federal target. Since September 2025, some data sources have become unavailable. But, based on economic circumstances and patterns of inflation since September, the trajectory of inflation is generally increasing. In the long term, this points towards higher compensation growth as the demand for higher compensation increases amidst inflation.
Contract Terminations
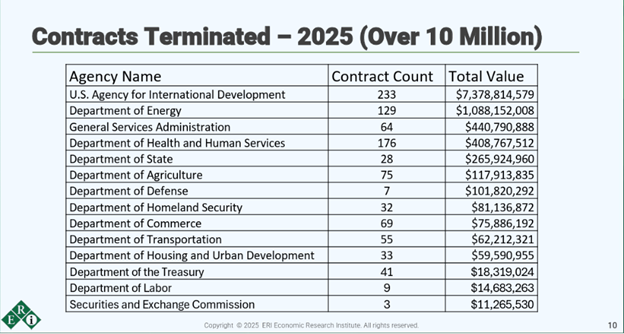
Overall contract terminations in the U.S. in 2025 were 9,500, worth approximately $32 billion. The Armed Services Board of Contract Appeals (ASBCA) saw a 34% year-over-year increase in the number of appeals, with 67% that were sustained. The Civilian Board of Contract Appeals (CBCA) saw a 22% increase in appeals, with 61% of those appeals sustained. It is likely that, among the contracts that were terminated, the number may be smaller due to these appeals. Now, which government agencies were impacted by these terminations?
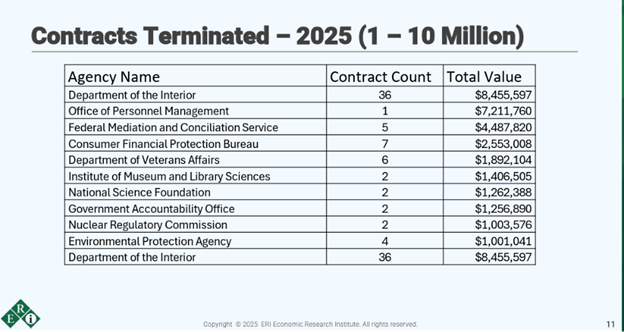
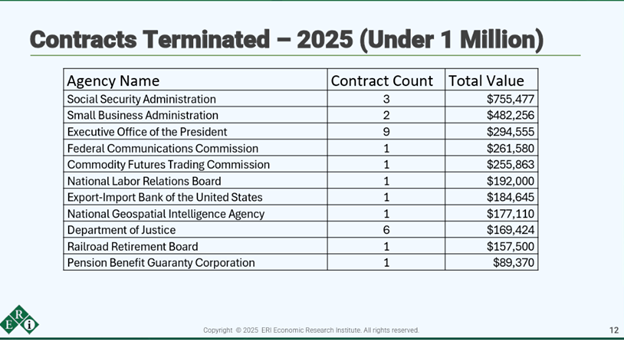
Among a sample of 1,000 contracts, ERI analyzed the government contractors that terminated contracts in 2025 and compiled them into three distinct groups, which are shown in the charts below. Group 1 are government contractors with over $10 million in contracts, group 2 with $1-10 million in contracts, and group 3 under $1 million in contracts.
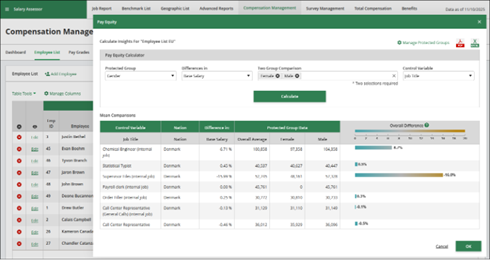
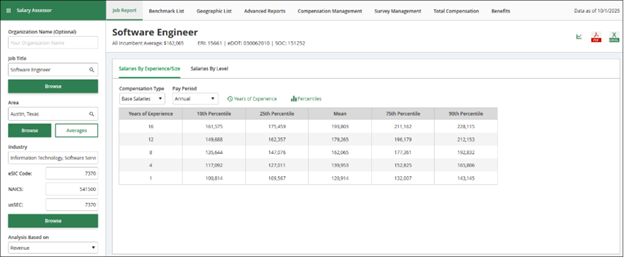
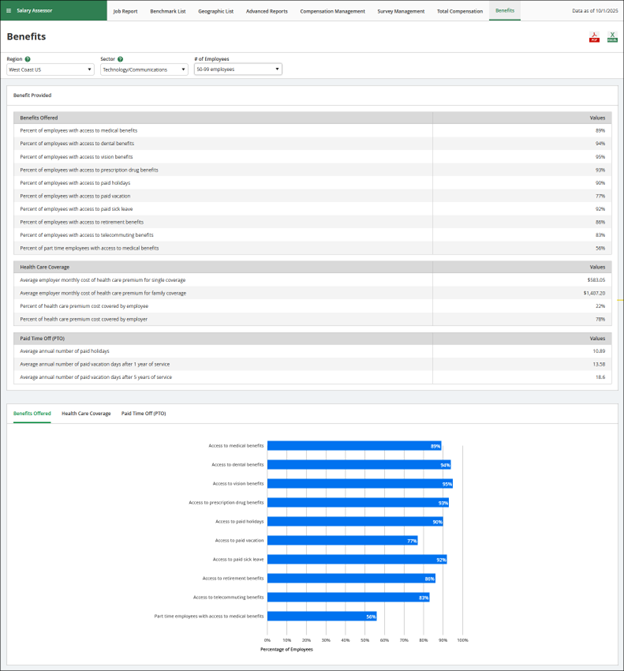
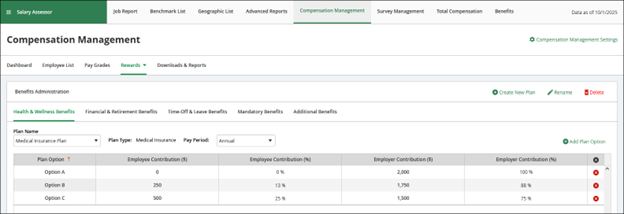
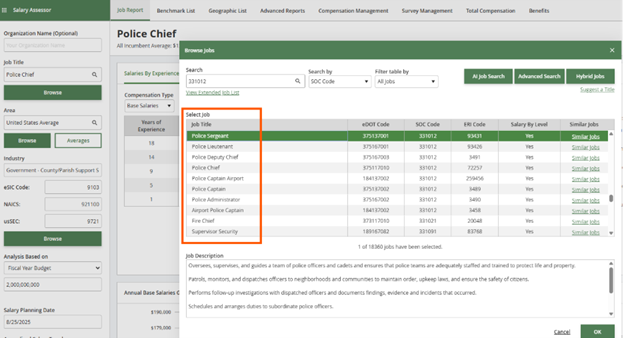
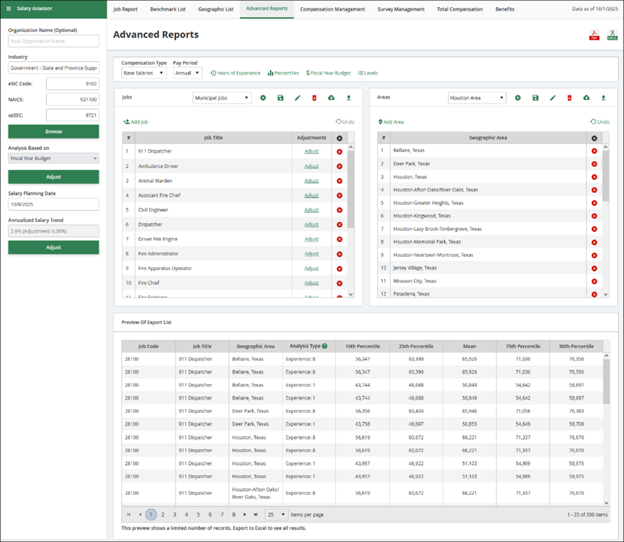
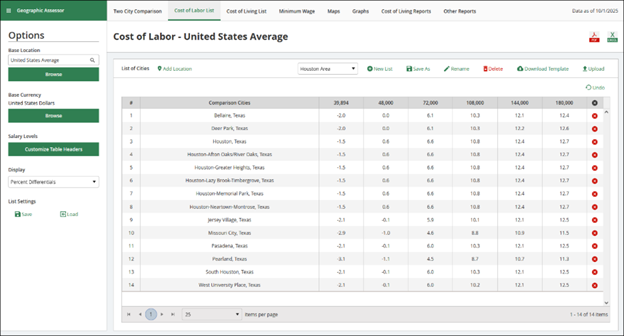
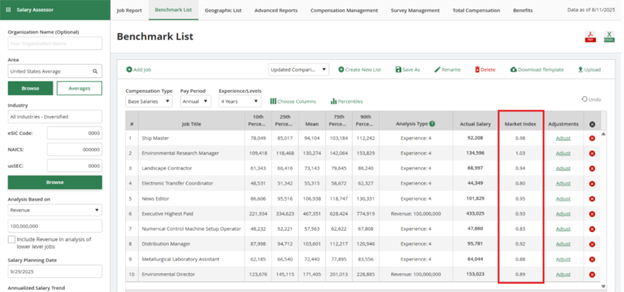
Using ERI’s Salary Assessor to Build Market-Based Contracts
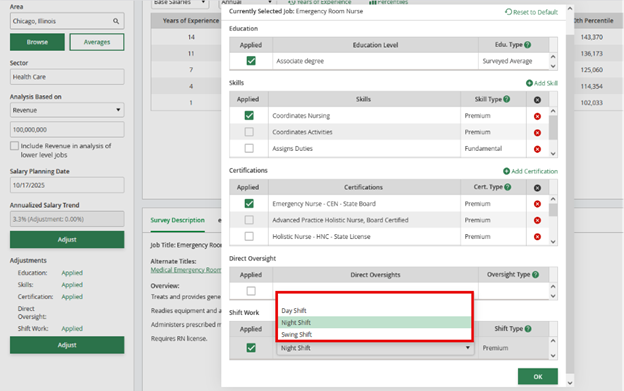
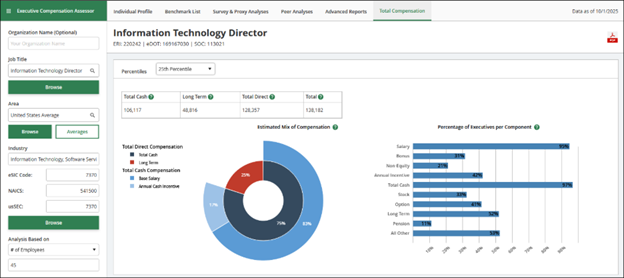
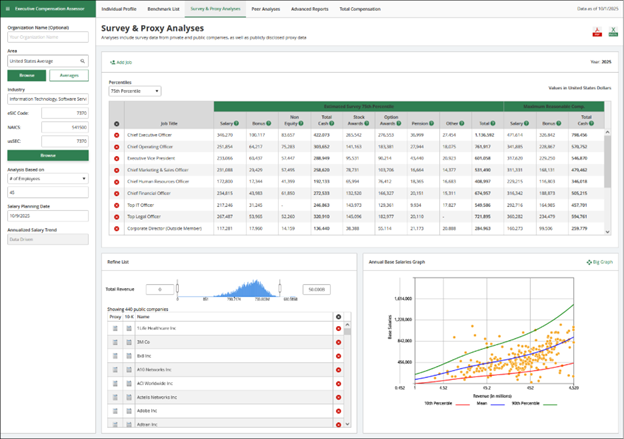
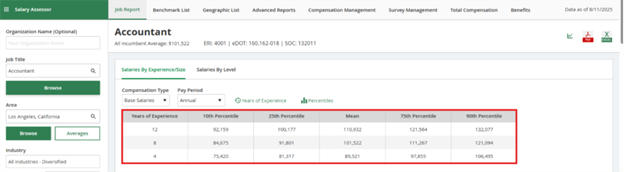
Because government contractors tend to target specific percentiles based on the type of contracts that they are targeting, ERI is the preferred government salary data source for government contractors to set reasonable and competitive rates. Using ERI’s Salary Assessor, subscribers can look up market-based labor cost targets in specific percentiles from the 10th percentile to the 90th percentile. ERI’s compensation management platform provides access to the validated government contractor salary compensation survey data needed to set competitive and strategic rates for proposals.
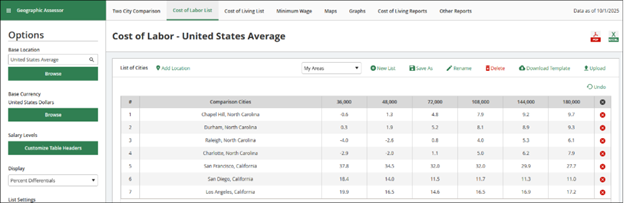
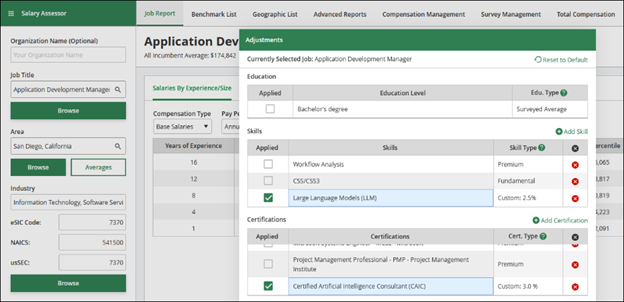
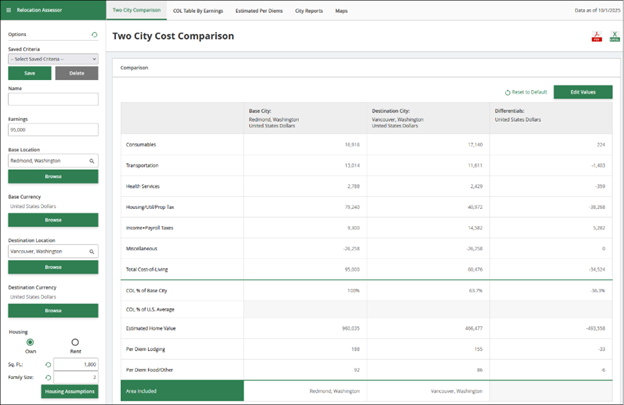
When deciding on rates for proposals, contractors often need to weigh contractual requirements with market realities, especially when positions span multiple labor categories, locations, and skills/certifications. ERI’s Salary Assessor supports that workflow by helping teams align a labor category (LCAT) to a defensible market benchmark, choose a target percentile that matches the competitiveness of the role, and reflect geographic differences so that the same job is not priced identically in different labor markets. It provides a consistent way to document assumptions and keep rates aligned across departments and bids, so that government contractors are not rebuilding logic from scratch with each proposal.
Ready to make compensation management easier? Click here for a free demo to begin your journey with ERI!
Sources
- Stahle, Cory. “Job Applications From Federal Workers Cooled in May After DOGE-driven Spike.” Hiring Lab, Economic Research by Indeed, 26 June, 2025. www.hiringlab.org/2025/06/26/job-applications-from-federal-workers-cooled-in-may/. Accessed 16 Dec, 2025.
- Wallace, Alicia. “A first look at November hiring shows the private sector lost 32,000 jobs.” CNN, 3 Dec, 2025. www.cnn.com/2025/12/03/economy/us-adp-private-jobs-report-november. Accessed 16 Dec, 2025.
- Bick, Alexander and Victoria Gregory. “Breakeven Employment Growth: A Simple but Useful Benchmark.” Federal Reserve of St. Louis, 15 April, 2025. www.stlouisfed.org/on-the-economy/2025/apr/breakeven-employment-growth-simple-useful-benchmark. Accessed 16 Dec, 2025.