In the last three years, since the introduction of generative artificial intelligence (GenAI) with the release of ChatGPT in November 2022, there has been much speculation about the impact of artificial intelligence on employment. Machine learning (ML), a branch of artificial intelligence (AI), is rapidly reshaping the job market, making some jobs obsolete while also creating new AI jobs in high demand. To stay competitive in the ever-changing tech industry, employees are increasingly gaining new skills and certifications specifically related to machine learning. With these upgrades to their resumes, employees are aiming for new and expanded roles that involve studying and developing statistical algorithms so that computers can learn from data without requiring explicit programing for individual tasks. Machine learning is at the forefront of AI innovation, and the job market is quick to respond.
With datasets updated at least every six weeks, ERI is constantly researching current compensation trends in the labor market, including the emergence of new skills and certifications in the technology sector. To help our customers make the most accurate and up-to-date adjustments to their internal jobs, here is the machine learning skills list that will be added to ERI’s robust compensation database in the July 1, 2026, release:
New skills and certifications often come with pay premiums, as reflected in the adjustments feature in ERI’s Assessor Platform. Use this feature to customize an internal job title with specific adjustments, including education, skills, certifications (including security clearance), shift work, and direct oversight. The platform allows you to stack up to three skills and three certifications per job. Each skill or certification may be classified as follows:
Premium (associated with a fixed salary increase % adjustment),
Fundamental (associated with a 0% adjustment), or
Custom(associated with a salary increase % adjustment that can be customized by the user).
To learn more about the skills and certifications related to machine learning in ERI’s compensation database or using the adjustments feature in the Assessor Platform, contact us or sign up for a guided tour.
Since the introduction of generative artificial intelligence (GenAI) with the release of ChatGPT in November 2022, there has been widespread concern about the impact on employment. Artificial intelligence (AI) is rapidly reshaping the job market, not only making some jobs obsolete but also creating new AI jobs in high demand. To stay competitive in the ever-changing tech industry, employees are increasingly acquiring new skills and certifications specifically related to AI. With these enhancements to their resumes, employees are aiming for new and expanded roles that take advantage of innovation in artificial intelligence. In this dynamic field, the job market is quick to respond with value placed on new AI skills.
With datasets updated at least every six weeks, ERI is constantly researching current compensation trends in the labor market, including the emergence of new skills and certifications in the technology sector. To help our customers make the most accurate and up-to-date adjustments to their internal jobs, our AI skills list will be updated with these additions to ERI’s robust compensation database in the July 1, 2026, release:
New skills and certifications often come with pay premiums, as reflected in the adjustments feature in ERI’s Assessor Platform. Use this feature to customize an internal job title with specific adjustments, including education, skills, certifications (including security clearance), shift work, and direct oversight. The platform allows you to stack up to three skills and three certifications per job. Each skill or certification may be classified as follows:
Premium (associated with a fixed salary increase % adjustment),
Fundamental (associated with a 0% adjustment), or
Custom(associated with a salary increase % adjustment that can be customized by the user).
To learn more about the skills and certifications related to artificial intelligence in ERI’s compensation database or using the adjustments feature in the Assessor Platform, contact us or sign up for a guided tour.
A sample of city, county and state/province North American minimum wage changes found in ERI’s Geographic Assessor is provided below.
To learn more about how we gather this data please visit our Minimum Wage page.
City Changes
Chicago, Illinois minimum wage will increase to $17.05 (effective 7/1/2026)
Chicago, Illinois minimum wage for tipped workers will increase to $12.96 (effective 7/1/2026) *
San Francisco, California minimum wage will increase to $19.61 (effective 7/1/2026)
County Changes
Cook County, Illinois minimum wage will increase to $15.40 (effective 7/1/2026) *
Cook County, Illinois minimum wage for tipped workers will increase to $9.25 (effective 7/1/2026) *
Howard County, Maryland minimum wage for workers of small business will increase to $16.00 (effective 7/1/2026) *
* For additional details like business size definitions, hotel employee definitions, tipped employee definitions, additional and upcoming rates, or links to source references please see the Minimum Wage tab in the Geographic Assessor.
June 2026 Updates
City Changes
Glendale, California minimum wage for hotel workers will increase to $25.00 (effective 7/1/2026) *
Los Angeles, California minimum wage for hotel and airport workers will increase to $25.00 (effective 7/1/2026) *
Santa Monica, California minimum wage for hotel workers will increase to $25.00 (effective 7/1/2026) *
County Changes
Prince George’s County, Maryland minimum wage for service contract workers will increase to $18.10 (effective 7/1/2026) *
State/Province Changes
Alaska minimum wage will increase to $14.00 (effective 7/1/2026)
Alaska minimum wage for school bus drivers will increase to $28.00 (effective 7/1/2026) *
May 2026 Updates
City Changes
Pasadena, California minimum wage will increase to $18.57 (effective 7/1/2026)
Emeryville, California minimum wage will increase to $20.34 (effective 7/1/2026)
Portland, Oregon minimum wage will increase to $16.80 (effective 7/1/2026) *
County Changes
Oregon non-urban counties minimum wage will increase to $14.55 (effective 7/1/2026) *
State/Province Changes
Oregon standard minimum wage will increase to $15.55 (effective 7/1/2026) *
April 2026 Updates
City Changes
Los Angeles, California minimum wage will increase to $18.42 (effective 7/1/2026)
County Changes
Montgomery County, Maryland minimum wage for large employers will increase to $18.00 (effective 7/1/2026) *
Montgomery County, Maryland minimum wage for mid-size employers will increase to $16.50 (effective 7/1/2026) *
Montgomery County, Maryland minimum wage for small employers will increase to $15.95 (effective 7/1/2026) *
State/Province Changes
British Columbia minimum wage will increase to C$18.25 (effective 6/1/2026)
March 2026 Updates
City Changes
District of Columbia minimum wage will increase to $18.40 (effective 7/1/2026)
District of Columbia minimum wage for tipped employees will increase to $10.30 (effective 7/1/2026) *
Malibu, CA minimum wage will increase to $17.91 (effective 7/1/2026)
State/Province Changes
New Brunswick minimum wage will increase to C$15.90 (effective 4/1/2026)
Yukon Territory minimum wage will increase to C$18.51 (effective 4/1/2026)
February 2026 Updates
City Changes
San Diego, California minimum wage for certain hotels and amusement parks will increase to $19.00 (effective 7/1/2026) *
San Diego, California minimum wage for hospitality employers at certain event centers will increase to $21.06 (effective 7/1/2026) *
State/Province Changes
Prince Edward Island minimum wage will increase to C$17.00 (effective 4/1/2026)
Nova Scotia minimum wage will increase to C$16.75 (effective 4/1/2026)
January 2026 Updates
City Changes
Oakland, California minimum wage will increase to $17.34 (effective 1/1/2026)
Oakland, California minimum wage for hotel employees with health benefits will increase to $18.85 (effective 1/1/2026) *
Oakland, California minimum wage for hotel employees without health benefits will increase to $25.14 (effective 1/1/2026) *
County Changes
San Mateo, California minimum wage for workers in unincorporated county areas will increase to $17.95 (effective 1/1/2026) *
State/Province Changes
New York minimum wage will increase to $16.00 (effective 1/1/2026)
New York minimum wage for tipped employees will increase to $13.30 (effective 1/1/2026) *
New York minimum wage for tipped food service employees will increase to $10.70 (effective 1/1/2026) *
December 2025 Updates
City Changes
Cupertino, California minimum wage will increase to $18.70 (effective 1/1/2026)
Portland, Maine minimum wage will increase to $16.75 (effective 1/1/2026)
County Changes
Boulder, Colorado minimum wage for workers in unincorporated county areas will increase to $16.82 (effective 1/1/2026) *
Boulder, Colorado minimum wage for tipped workers in unincorporated county areas will increase to $13.80 (effective 1/1/2026) *
State/Province Changes
Rhode Island minimum wage will increase to $16.00 (effective 1/1/2026)
November 2025 Updates
City Changes
Flagstaff, Arizona minimum wage will increase to $18.35 (effective 1/1/2026)
San Diego, California minimum wage will increase to $17.75 (effective 1/1/2026)
Seattle, Washington minimum wage will increase to $21.30 (effective 1/1/2026)
State/Province Changes
Washington state minimum wage will increase to $17.13 (effective 1/1/2026)
Washington state minimum wage for minors will increase to $14.56 (effective 1/1/2026) *
October 2025 Updates
City Changes
Denver, Colorado minimum wage will increase to $19.29 (effective 1/1/2026)
Denver, Colorado minimum wage for tipped workers will increase to $16.27 (effective 1/1/2026) *
State/Province Changes
Manitoba minimum wage will increase to C$16.00 (effective 10/1/2025)
Saskatchewan minimum wage will increase to C$15.35 (effective 10/1/2025)
California minimum wage will increase to $16.90 (effective 1/1/2026)
September 2025 Updates
City Changes
Long Beach, California minimum wage for concessionaire workers will increase to $25.00 (effective 10/1/2025) *
State/Province Changes
Nova Scotia minimum wage will increase to C$16.50 (effective 10/1/2025)
Ontario minimum wage will increase to C$17.60 (effective 10/1/2025)
Prince Edward Island minimum wage will increase to C$16.50 (effective 10/1/2025)
August 2025 Updates
State/Province Changes
Northwest Territories minimum wage will increase to C$16.95 (effective 9/1/2025)
Nunavut minimum wage will increase to C$19.75 (effective 9/1/2025)
Florida minimum wage will increase to $14.00 (effective 9/30/2025)
Florida minimum wage for tipped workers will increase to $10.98 (effective 9/30/2025) *
July 2025 Updates
City Changes
Alameda, CA minimum wage will increase to $17.46 (effective 7/1/2025)
Chicago, IL minimum wage will increase to $16.60 (effective 7/1/2025)
Chicago, IL minimum wage for tipped workers will increase to $12.62 (effective 7/1/2025) *
Chicago, IL minimum wage for youth workers will increase to $16.50 (effective 7/1/2025) *
County Changes
Los Angeles, CA minimum wage for unincorporated areas will increase to $17.81 (effective 7/1/2025) *
June 2025 Updates
City Changes
Portland, Oregon minimum wage will increase to $16.30 (effective 7/1/2025) *
County Changes
Oregon nonurban counties minimum wage will increase to $14.05 (effective 7/1/2025) *
State/Province Changes
British Columbia minimum wage will increase to C$17.85 (effective 6/1/2025)
Oregon standard minimum wage will increase to $15.05 (effective 7/1/2025) *
May 2025 Updates
City Changes
Fremont, CA minimum wage will increase to $17.75 (effective 7/1/2025)
San Francisco, CA minimum wage will increase to $19.18 (effective 7/1/2025)
San Francisco, CA minimum wage for government supported employees will increase to $16.97 (effective 7/1/2025) *
State/Province Changes
Québec minimum wage will increase to C$16.10 (effective 5/1/2025)
Québec minimum wage for tipped employees will increase to C$12.90 (effective 5/1/2025) *
April 2025 Updates
City Changes
Bellingham, WA minimum wage will increase to $18.66 (effective 5/1/2025)
County Changes
Montgomery County, MD minimum wage for large businesses will increase to $17.65 (effective 7/1/2025)*
Montgomery County, MD minimum wage for mid-size businesses will increase to $16.00 (effective 7/1/2025)*
Montgomery County, MD minimum wage for small businesses will increase to $15.50 (effective 7/1/2025)*
State/Province Changes
Yukon Territory minimum wage for will increase to C$17.94 (effective 4/1/2025)
March 2025 Updates
City Changes
Los Angeles, CA minimum wage will increase to $17.87 (effective 7/1/2025)
County Changes
Santa Fe county, NM minimum wage in unincorporated areas will increase to $15.00 (effective 3/1/2025)
Santa Fe county, NM minimum wage for tipped employees in unincorporated areas will increase to $4.48 (effective 3/1/2025) *
State/Province Changes
Newfoundland and Labrador minimum wage for will increase to C$16.00 (effective 4/1/2025)
February 2025 Updates
City Changes
District of Columbia minimum wage will increase to $17.95 (effective 7/1/2025)
Bellingham, WA minimum wage will increase to $18.66 (effective 7/1/2025)
State/Province Changes
Alaska minimum wage for will increase to $13.00 (effective 7/1/2025)
January 2025 Updates
City Changes
Oakland, CA minimum wage will increase to $16.89 (effective 1/1/2025)
Renton, WA minimum wage for large businesses will increase to $20.90 (effective 1/1/2025) *
Renton, WA minimum wage for mid-size businesses will increase to $18.90 (effective 1/1/2025) *
State/Province Changes
Missouri minimum wage for will increase to $13.75 (effective 1/1/2025)
Missouri minimum wage for tipped employees will increase $6.88 (effective 1/1/2025) *
Montana minimum wage for will increase to $10.55 (effective 1/1/2025)
December 2024 Updates
City Changes
Menlo Park, CA minimum wage will increase to $17.10 (effective 1/1/2025)
Portland, ME minimum wage will increase to $15.50 (effective 1/1/2025)
Portland, ME minimum wage for tipped employees will increase to $7.75 (effective 1/1/2025) *
State/Province Changes
Alaska minimum wage will increase to $11.91 (effective 1/1/2025)
Washington state minimum wage for will increase to $16.66 (effective 1/1/2025)
November 2024 Updates
City Changes
Seattle, WA minimum wage for all employers will increase to $20.76 (effective 1/1/2025)
Belmont, CA minimum wage will increase to $17.95 (effective 1/1/2025)
State/Province Changes
South Dakota minimum wage will increase to $11.50 (effective 1/1/2025)
South Dakota minimum wage for tipped employees will increase to $5.75 (effective 1/1/2025) *
New Jersey minimum wage will increase to $15.49 (effective 1/1/2025)
October 2024 Updates
City Changes
Denver minimum wage will increase to $18.81 (effective 1/1/2025)
Denver tipped minimum wage will increase to $15.79 (effective 1/1/2025) *
State/Province Changes
Virginia minimum wage will increase to $12.41 (effective 1/1/2025)
Rhode Island minimum wage will increase to $15.00 (effective 1/1/2025)
September 2024 Updates
State/Province Changes
Manitoba minimum wage will increase to C$15.80 (effective 10/1/2024)
Saskatchewan minimum wage will increase to C$15.00 (effective 10/1/2024)
Prince Edward Island minimum wage will increase to C$16.00 (effective 10/1/2024)
August 2024 Updates
State/Province Changes
Northwest Territories minimum wage will increase to C$16.70 (effective 9/1/2024)
Florida minimum wage will increase to $13.00 (effective 9/30/2024)
Florida minimum wage for tipped workers will increase to $9.98 (effective 9/30/2024) *
Ontario minimum wage will increase to C$17.20 (effective 10/1/2024)
July 2024 Updates
City Changes
Berkeley, CA minimum wage will increase to $18.67 (effective 7/1/2024)
Emeryville, CA minimum wage will increase to $19.36 (effective 7/1/2024)
Chicago, IL standard minimum wage will increase to $16.20 (effective 7/1/2024) *
Chicago, IL standard tipped minimum wage will increase to $11.02 (effective 7/1/2024) *
County Changes
Cook County, IL minimum wage will increase to $14.05 (effective 7/1/2024)
June 2024 Updates
City Changes
San Francisco, CA minimum wage will increase to $18.67 (effective 7/1/2024)
Portland, OR metro area minimum wage will increase to $15.95 (effective 7/1/2024) *
County Changes
Oregon nonurban counties minimum wage will increase to $13.70 (effective 7/1/2024) *
State/Province Changes
Nevada minimum wage will increase to $12.00 (effective 7/1/2024)
Oregon standard minimum wage will increase to $14.70 (effective 7/1/2024) *
May 2024 Updates
City Changes
Renton, WA minimum wage for large employers will increase to $20.29 (effective 7/1/2024) *
Renton, WA minimum wage for small employers will increase to $18.29 (effective 7/1/2024) *
Fremont, CA minimum wage will increase to $17.30 (effective 7/1/2024)
State/Province Changes
Puerto Rico minimum wage will increase to $10.50 (effective 7/1/2024)
April 2024 Updates
City Changes
Los Angeles minimum wage will increase to $17.28 (effective 7/1/2024)
Los Angeles minimum wage for hotel workers will increase to $20.32 (effective 7/1/2024) *
County Changes
Unincorporated Los Angeles County minimum wage will increase to $17.27 (effective 7/1/2024)
State/Province Changes
British Columbia minimum wage will increase to C$17.40 (effective 6/1/2024)
March 2024 Updates
City Changes
Santa Monica, CA minimum wage will increase to $17.27 (effective 7/1/2024)
Minneapolis, MN minimum wage for small employers will increase to $15.57 (effective 7/1/2024) *
State/Province Changes
New Brunswick minimum wage will increase to C$15.30 (effective 4/1/2024)
Québec minimum wage will increase to C$15.75 (effective 5/1/2024)
Québec minimum wage for tipped employees will increase to C$12.60 (effective 5/1/2024) *
February 2024 Updates
City Changes
District of Columbia minimum wage will increase to $17.50 (effective 7/1/2024)
District of Columbia minimum wage for tipped employees will increase to $10.00 (effective 7/1/2024) *
Tukwila, WA minimum wage for employees of mid-sized employers will increase to $19.29 (effective 7/1/2024) *
State/Province Changes
California minimum wage for fast food workers will increase to $20.00 (effective 4/1/2024) *
January 2024 Updates
City Changes
Flagstaff, AZ minimum wage will increase to $17.40 (effective 1/1/2024) *
Flagstaff, AZ minimum wage for tipped employees will increase to $15.90 (effective 1/1/2024) *
County Changes
Cook County, IL minimum wage will increase to $14.00 (effective 1/1/2024)
Cook County, IL minimum wage for tipped employees will increase to $8.40 (effective 1/1/2024) *
State/Province Changes
Maryland minimum wage will increase to $15.00 (effective 1/1/2024)
Maryland minimum wage for youth employees will increase to $12.75 (effective 1/1/2024) *
Montana minimum wage will increase to $10.30 (effective 1/1/2024)
December 2023 Updates
City Changes
Sonoma, CA minimum wage for large employers will increase to $17.60 (effective 1/1/2024) *
Sonoma, CA minimum wage for small employers will increase to $16.56 (effective 1/1/2024) *
County Changes
Boulder County, CO (unincorporated areas only) minimum wage will come into effect at $15.69 (effective 1/1/2024)
Boulder County, CO (unincorporated areas only) minimum wage for tipped employees will come into effect at $12.67 (effective 1/1/2024) *
State/Province Changes
Arizona minimum wage will increase to $14.35 (effective 1/1/2024)
Arizona minimum wage for tipped employees will increase to $11.35 (effective 1/1/2024) *
November 2023 Updates
City Changes
Seattle, WA minimum wage for all large employers and for small employers whose employees do not receive a specified amount of medical benefits and tips will increase to $19.97 (effective 1/1/2024) *
Seattle, WA minimum wage for small employers whose employees do receive a specified amount of medical benefits and/or tips will increase to $17.25 (effective 1/1/2024) *
Tukwila, WA minimum wage for large employers will increase to $20.29 (effective 1/1/2024) *
Tukwila, WA minimum wage for small employers will increase to $18.29 (effective 1/1/2024) *
State/Province Changes
Ohio minimum wage will increase to $10.45 (effective 1/1/2024)
Ohio minimum wage for tipped employees will increase to $5.25 (effective 1/1/2024) *
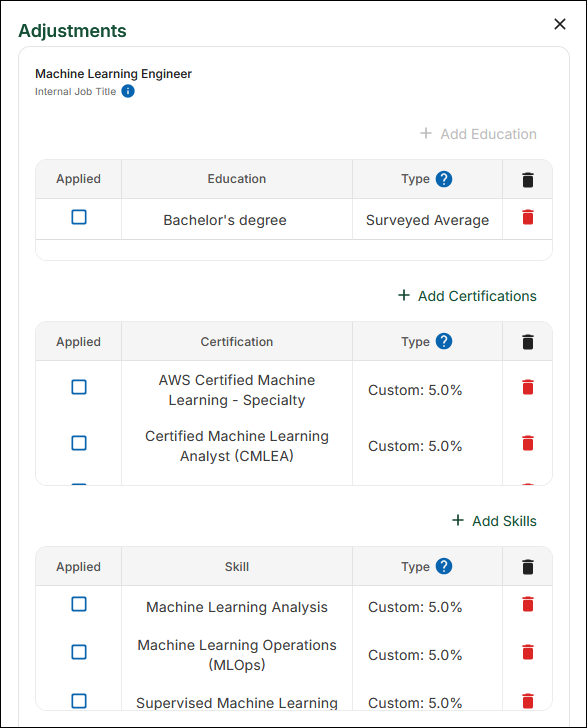
Machine learning (ML), a branch of artificial intelligence (AI), is rapidly reshaping the job market, creating new AI jobs in high demand. To stay competitive in the ever-changing tech industry, employees are increasingly acquiring new certifications and skills specifically related to machine learning. With these enhancements to their resumes, employees are aiming for new and expanded roles that involve studying and developing statistical algorithms so that computers can learn from data without requiring explicit programing for individual tasks. Machine learning is at the forefront of AI innovation, and the job market is quick to respond.
With datasets updated at least every six weeks, ERI is constantly researching current compensation trends in the labor market, including the emergence of new skills and certifications in the technology sector. To help our customers make the most accurate and up-to-date adjustments to their internal jobs, here is a list of new AI certifications specifically related to machine learning that were recently added to ERI’s robust compensation database:
AI and Machine Learning Professional
Apache Spark Developer Certification
Applied Generative AI for Digital Transformation Certificate
New AI machine learning certifications and skills often come with pay premiums, as reflected in the adjustments feature in ERI’s Assessor Platform. Use this feature to customize an internal job title with specific adjustments, including education, skills, certifications (including security clearance), shift work, and direct oversight. The platform allows you to stack up to three skills and three certifications per job. Each skill or certification may be classified as follows:
Premium (associated with a fixed salary increase % adjustment),
Fundamental(associated with a 0% adjustment), or
Custom (associated with a salary increase % adjustment that can be customized by the user).
To learn more about the skills and certifications related to machine learning in ERI’s compensation database or using the adjustments feature in the Assessor Platform, contact us or sign up for a guided tour.
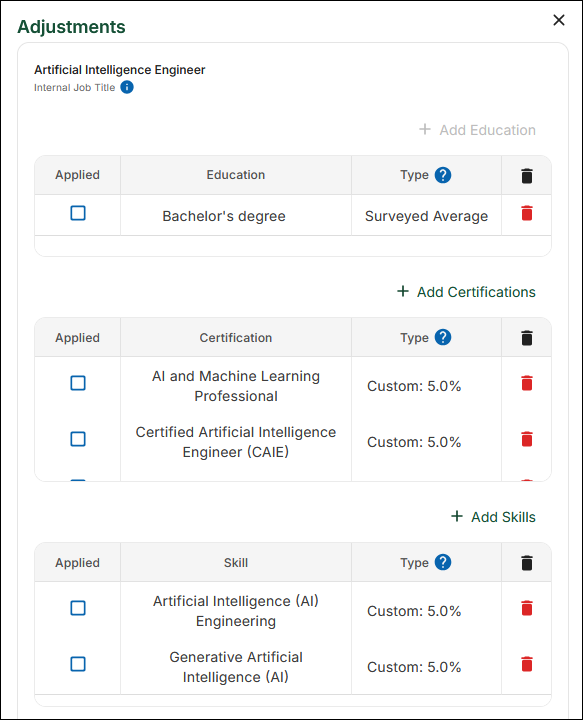
Artificial intelligence (AI) is rapidly reshaping the job market, making some jobs obsolete while creating new AI jobs in high demand. To stay competitive in the ever-changing tech industry, employees are increasingly acquiring new certifications and skills specifically related to AI. With these enhancements to their resumes, employees are aiming for new and expanded roles that grapple with the AI revolution. Innovation is the name of the game, and the job market is quick to respond.
With datasets updated at least every six weeks, ERI is constantly researching current compensation trends in the labor market, including the emergence of new skills and certifications in the technology sector. To help our customers make the most accurate and up-to-date adjustments to their internal jobs, here is a list of new AI-related certifications recently added to ERI’s robust compensation database:
AAMC AI in Medicine Certificate
ABA Certificate in AI and the Practice of Law
AICPA AI for Finance Certificate
Anthropic Prompt Engineering Course
ARTIBA Artificial Intelligence Engineer (AIE)
ARTIBA Generative AI Engineer (GAIE)
ASTQB AI Testing Foundation
ATD AI for Talent Development Credential
AWS Certified AI Practitioner
AWS Partner: Generative AI Essentials
BCS Essentials Certificate in Artificial Intelligence
BCS Foundation Certificate in Artificial Intelligence
New AI skills and certifications often come with pay premiums, as reflected in the adjustments feature in ERI’s Assessor Platform. Use this feature to customize an internal job title with specific adjustments, including education, skills, certifications (including security clearance), shift work, and direct oversight. The platform allows you to stack up to three skills and three certifications per job. Each skill or certification may be classified as follows:
Premium (associated with a fixed salary increase % adjustment),
Fundamental(associated with a 0% adjustment), or
Custom(associated with a salary increase % adjustment that can be customized by the user).
To learn more about the skills and certifications related to artificial intelligence in ERI’s compensation database or using the adjustments feature in the Assessor Platform, contact us or sign up for a guided tour.
ERI Economic Research Institute recently released its 2026 Benefits Benchmarking Survey, providing an invaluable resource to organizations in the process of building and updating competitive employee benefits packages. In addition to a comprehensive analysis of health care benefits, this 19th edition of the survey includes detailed sections on life and disability insurance, paid time off, retirement, and executive prerequisites. Participation was solicited from employers in the public, private, and nonprofit sectors, as well as government entities in the United States. Data cuts are provided by organization sector, industry group, organization size (number of employees), and geographic region.
Overview
While health care continues to be the primary and most expensive employee benefit, there are myriad other benefits to consider in an employee’s total compensation package. Having a well-rounded and clearly communicated benefits package can give an organization an edge to both recruit and retain top talent. Knowledge of the marketplace is powerful, and the ability to benchmark one’s benefits practices with those of other employers in the external marketplace is the first step in evaluating the effectiveness of current and future benefits strategies.
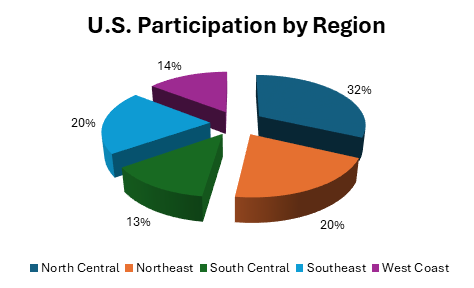
Benchmarking employer-provided employee benefits is the focus of ERI’s 2026 Benefits Benchmarking Survey. Selected findings based on this year’s survey are presented below, along with some trend information that may be influenced by the mix of survey participants from year to year. Sixty-nine (69) data submissions representing 564,433 employees were received from participants in this survey. Representation by region in the United States is as follows:
General Benefits
Sixty-seven percent (67%) of the respondents supplied information on the overall cost of benefits as a percentage of payroll. Of the responding organizations, 63% reported the cost of benefits for executive officer(s) at less than 25% of payroll. Thirty-three percent (33%) reported the cost of exempt employees’ benefits at less than 25% of payroll. Forty-three percent (43%) reported the cost of nonexempt employees’ benefits at less than 25% of payroll.
The top five employee programs offered by respondents that fall outside the scope of health insurance, life insurance, disability, retirement, and paid time off are paid holidays at 96%, holiday parties at 78%, hybrid workplace at 75%, full-time business casual policy at 67%, and remote workplace at 65%. Forty-five percent (45%) of respondents reported that part-time employees are not eligible for benefits, including paid time off. Eighty-three percent (83%) of respondents reported that retired employees are not eligible for benefits.
General Health Care Practices
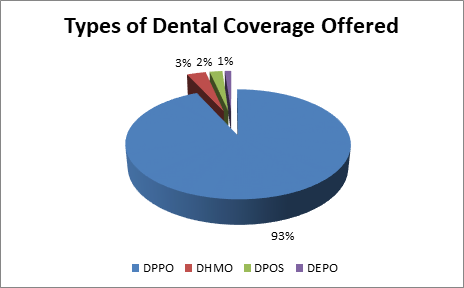
Most organizations understand the value of providing well-rounded health care coverage that includes medical, dental, and vision benefits. Sixty-seven (67) respondents offered at least one medical plan to full-time employees. Two of the sixty-nine respondents did not offer dental benefits, and three did not offer vision benefits. Of the fifty-one (51) respondents offering details of vision benefits, three included vision as part of the medical plan. The most prevalent primary medical plan offered was a Preferred Provider Organization (PPO) plan, and the most prevalent dental plan offered was a Dental Preferred Provider Organization (DPPO) plan.
With the cost of health care constantly increasing, organizations need to strike the right balance between cost-saving methods and the provision of attractive benefits that retain and motivate employees. Forty-six percent (46%) of respondents reported increasing employee contributions to premiums as a cost-saving measure. Nineteen percent (19%) of respondents introduced a health promotion and/or wellness program as a cost-saving measure. Twenty percent (20%) of the respondents moved drugs off their prescription drug formulary.
Medical Benefits
Eligibility for health care benefits and the type(s) of medical benefits offered to employees are critical decisions for all organizations. Thirty-nine percent (39%) of respondents reported that executives become eligible for health care benefits immediately upon employment and, similarly, 39% of participants reported the same eligibility for exempt employees. Slightly fewer respondents, specifically, 38% of participants, reported that nonexempt employees become eligible for health care benefits immediately upon employment.
This year, the two most popular plan types amongst eligible employees enrolled in health care plans were the Exclusive Provider Organization (EPO), enrolling 51% of employees, and Preferred Provider Organization (PPO), enrolling 43% of employees, followed by Health Maintenance Organization (HMO) plans at 5% and Point-of-Service (POS) at 1%.
Keeping track of current trends in employer-provided medical benefits can be immensely valuable as organizations strive to strike the right balance between employee and employer costs. The average monthly employee cost for Preferred Provider Organization plans for employee-only coverage was $153.41, up from $144.89 in 2025 but still lower than $159.94 in 2015. The employer cost for employee-only coverage for Preferred Provider Organization plans equaled 81%, the same as in 2025. In this year’s survey, the average deductible reported in a High-Deductible Health Plan (HDHP) arrangement was $2,841, down from $3,102.00 in 2025.
Many medical plans offer an array of provisions beyond the typical health care benefits that employees have come to expect. Most medical plans offered some form of wellness and/or disease management programs to participants. Fifty-three percent (53%) of plans provide an Employee Assistance Plan (EAP), while 15% offer Complementary and Alternative Medicine (CAM) provisions.
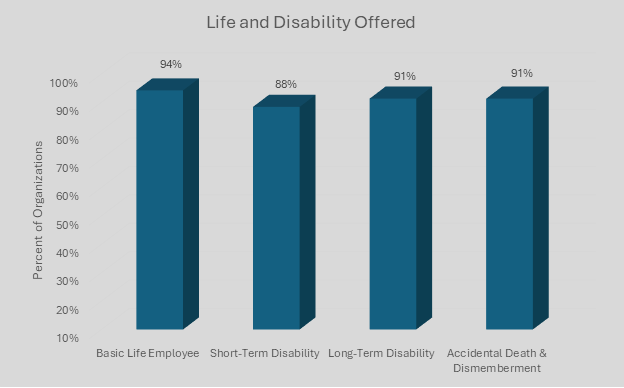
Life and Disability Insurance
When employees face accidents, short- and long-term illnesses, and death, life and disability insurance become essential, making these benefits commonplace in most organizations. Ninety-four percent (94%) of respondents offered some form of basic life insurance to employees. Eighty-seven percent (87%) offered supplemental life insurance and 80% of respondents offered supplemental dependent life insurance. Ninety-one percent (91%) of respondents offered long-term disability insurance and 88% offered short-term disability insurance.
Employee Leave Practices
How organizations administer time off for employees can be a complicated decision, particularly as employees increasingly value a healthy work-life balance. Fifty-five percent (55%) of respondents offered traditional leave plans that typically consist of vacation, sick time, bereavement, personal leave, holidays, and floating holidays. The average number of fixed holidays among respondents was nine days per year. Forty-five percent (45%) of respondents used a pooled-leave system that combines all or part of paid leave into one pool. The average number of days granted at one year of service in reported pooled-leave plans was eighteen days. The average number of days granted at 10 years of service in reported pooled-leave plans was 30 days. Ease of administration was the most common reason given for using a pooled-leave system.
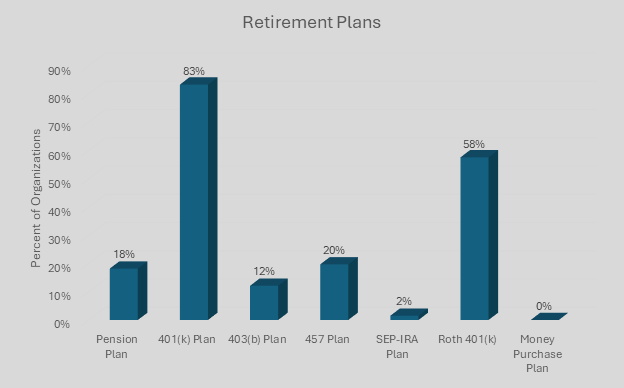
Retirement
Saving for retirement is essential for employees of all ages, so the retirement benefits offered by organizations are an important piece in an employee’s overall total compensation package. Sixty-six (66) of the 69 respondents offered some type of retirement plan to employees. Eighty-three percent (83%) of the organizations providing a retirement plan offered a 401(k) plan. The most common form of vesting schedule in reported defined contribution plans was 100% immediate vesting.
Executive Perquisites
In a highly competitive market for top-tier executive talent, organizations often include executive perks, including financial and non-financial benefits, in their executive compensation packages. Sixty-seven percent (67%) of respondents offered at least one executive perquisite. The five most prevalent executive perquisites included association or professional society dues/membership, conference travel expenses, conference registration fees, car or car allowance, and relocation expenses.
To drill down on actual costs and further details on employer-provided employee benefits in today’s competitive marketplace, please see the full 2026 Benefits Benchmarking Survey report, which is available for purchase by contacting ERI at [email protected] or 1-800-627-3697. For more information on this important annual survey, including the opportunity to participate in next year’s survey, please visit www.erieri.com/salarysurveys/benefits.
How Can ERI Help?
Building a competitive employee benefits package that attracts, retains, and motivates employees, while aligning with an organization’s budgetary requirements, is critical for organizations of all sizes. HR and compensation professionals need to stay on top of current trends in employee benefits with data customized to reflect comparable organizations in their market. ERI’s Benefits Benchmarking Survey provides an in-depth report of employer-provided employee non-cash benefits from a broad range of participating organizations, with actual costs and coverage details reported by organization sector (privately and publicly owned for-profit, nonprofit, and government organizations), industry group, organization size (number of employees), and geographic region.
For a broader analysis, the Benefits solution in ERI’s Salary Assessor provides a robust database of employee benefits data, including information contributed by the Benefits Benchmarking Survey and additional sources of employer-reported data, in an easy-to-use online platform that helps you quickly drill down on the data you need and export customized reports.
Beyond benchmarking employee benefits data from comparable organizations, HR and compensation professionals need to carefully design, administer, communicate, and maintain their benefits plans. Using the Compensation Management solution in ERI’s Salary Assessor, organizations can efficiently and effectively manage all aspects of their employee benefits packages, including budget adherence and ongoing annual reviews. ERI’s Total Rewards Statementprovides a complete breakdown of individual employee pay with employee and employer contributions to optional and mandated benefits, helping organizations communicate their benefits decisions to both stakeholders and employees. ERI is here to help you with all the steps involved in building a competitive employee benefits package, saving you time while ensuring accuracy.
For more information about ERI’s Assessor Platform, please sign up for a guided tour and let us show you how we can help you create and maintain a competitive benefits package tailored to your organization.
In today’s dynamic global economy, rising inflation has far-reaching effects at all organizational levels. From budgeting for essential materials and sourcing suppliers to employee buying power and how salary increases impact employee motivation, inflation is on everyone’s mind. ERI’s Assessor Platform, backed by over 35 years of compensation research, has tracked the ebb and flow of inflation over time, with data updated every six weeks (or whenever special circumstances warrant an update) to keep our finger on the pulse of current trends in the labor market. Frequent dataset updates are a key part of maintaining the accuracy of ERI’s Assessor Series, leading many to wonder how specific economic trends are incorporated into our robust compensation database. Looking specifically at cost of living and inflation, we were asked, “Does ERI account for inflation when updating geographic pay differentials?” Our response below seeks to offer some context for HR and compensation professionals concerned about the impacts of inflation.
Cost of living and inflation are primarily employee-expense based, while cost of labor and geographic pay differentials are employer-pay oriented. As a result, geographic pay differentials can reflect the long-term effects of inflation as market pay levels adjust, but they are not designed to capture short-term inflationary swings in real time. Inflation can move more quickly and more sharply than labor costs, both upward and downward, so updates to geographic pay differentials will more likely reflect sustained trends rather than immediate fluctuations.
Over time, these measures are often correlated. Locations with a higher cost of living tend to develop higher market pay levels, which, in turn, can contribute to higher local living costs. Geographic pay differentials are intended to reflect pay variation across geographic areas, whereas broader national increases in the cost of living are more appropriately captured in changes in average U.S. salary levels over time. Those salary changes, however, also tend to occur with some lag and are typically less volatile than inflation itself.
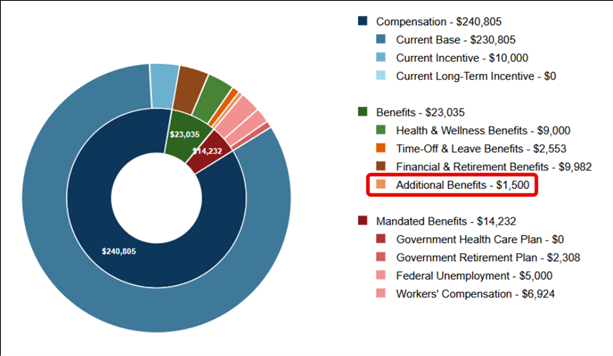
When considering the more immediate impacts of inflation, pay adjustments for sudden inflationary increases are typically handled as short-term or one-time adjustments rather than incorporated into base pay, as inflation spikes are often temporary. To support this, ERI’s Salary Assessor provides useful tools for planning short-term or one-time adjustments, such as a cost-of-living stipend. Using the Benefits feature in the Total Rewards section of Compensation Management, subscribers can add a cost-of-living stipend under Additional Benefits and then apply the stipend to relevant employee(s) in the Employee List. By exporting and sharing a Total Rewards Statement, employees will be able to see the Additional Benefits that they have been allotted.
Use ERI’s Compensation Management platform to plan and communicate cost-of-living stipends in a Total Rewards Statement.
ERI has been aggregating and analyzing salary survey data for over three decades, with data accuracy remaining our top priority throughout that time. We have tracked compensation for thousands of job titles through myriad economic cycles, including periods of high and low inflation, and are continuously evaluating trends in the labor market to provide subscribers with the most timely and reliable cost-of-labor and cost-of-living data available.
As artificial intelligence (AI) revolutionizes the way that organizations operate around the globe, many are concerned about AI potentially reshaping and replacing jobs, such as writers, graphic designers, and software engineers. While that is a valid concern worthy of further investigation, on the other hand, this rapidly developing technology has also created a host of new jobs that specialize in AI. With datasets updated at least every six weeks, ERI is constantly researching current compensation trends in the labor market, including the emergence of new jobs in technology. To that end, here is a list of new AI-related job titles recently added to ERI’s robust compensation database:
AI Agent Developer
AI Agent Engineer
AI Artist
AI Conversation Designer
AI Developer
AI Forward Deployed Engineer
AI Governance and Data Director
AI Infrastructure Engineer
AI Knowledge Architect
AI Model Trainer
AI Operations Specialist
AI Policy Analyst
AI Product Manager
AI Products Director
AI Products Vice President
AI Software Engineer
AI Solutions Architect
AI Strategist
Artificial Intelligence Architect
Artificial Intelligence Consultant
Artificial Intelligence Engineer
Artificial Intelligence Researcher
Artificial Intelligence Specialist
Chief Artificial Intelligence Officer
Director Artificial Intelligence
Director Generative AI
Infrastructure Engineer
Management Analyst
Technical Subject Matter Expert
Vice President Artificial Intelligence
Vice President of AI Strategy
The list above is a sample of new AI-related job titles recently added to the Assessor Platform, with new job titles incorporated regularly. To learn more about the various job title’s available in the Assessor Platform, including AI-related roles, browse by category or search for a specific role in our job titles list.
If you cannot find a desired job title using the Search Jobsengine within an Assessor application, click “Suggest a Title” to submit a job title and job description. ERI researchers will analyze the title and description in order to consider adding it to the Assessor Series database.
As AI technology evolves, ERI remains focused on responsible implementation, with solutions anchored in research, data integrity, and practical applicability. Every model we build is designed to enhance clarity, consistency, and confidence for compensation professionals.
At its core, ERI’s AI strategy is about augmenting expertise with intelligence by combining decades of compensation knowledge with modern AI innovation to solve real-world problems with accuracy and insight.
The National Price Level (NPL) Indexis highly regarded in economic analysis and serves as a barometer of a nation’s overall price levels, providinginvaluable insights into inflation, purchasing power, and economic health.This blog will discusswhat the NPL Index isand why it matters.
What Is the National Price Level Index?
The National Price Level Indexis a statistical measure used to monitor the average fluctuations in local prices of a set market basketof goods and services consumed over a one-year period. They compare current price levels to those of a base period, usually referencing a specific base year.
How Is It Calculated?
The NPL Index is the ratio of purchasing power parities (PPPs) to market exchange rates.
PPP Value / Exchange Rate to U.S. Dollar = National Price Level Index
National Price Level Index (NPL): This indicator measures the different general price levels between countries. The NPL is measured as an index using the U.S. NPL value as the reference base. For our National Price Level Index calculations, we use the annual average exchange rates correlated to the PPP value.
Purchasing Power Parities (PPPs): These are currency conversion metrics intended to align the purchasing strength of various currencies by eradicating disparities in price levels across nations. PPPs ensure that a given amount of money has the same purchasing power across different countries. The market basket of goods and services represents all related items that are involved with final expenditures, including final household and government consumption expenditures, investments in physical assets, and net exports. This measure is expressed in terms of the national currency per one U.S. dollar.
Exchange Rates: This measure represents the value of one country’s currency relative to another country’s currency. Please note that exchange rates constantly fluctuate.
Why Is It Important?
The National Price Level Index offers valuable perspectives for consumers. Here are some common uses:
Inflation Monitoring: The NPL Index is valuable for monitoring inflationary trends within an economy. Central banks and policymakers closely monitor this index to estimate the effectiveness of monetary policies and make informed decisions about interest rates.
Purchasing Power Analysis: Changes in price levels directly impact the purchasing power of consumers. By tracking the price index, economists and policymakers can assess how changes in prices affect consumers’ ability to buy goods and services in a specific country.
Economic Health Assessment: Fluctuations in the price index can indicate broader economic health. Sustained increases in price levels may signal overheating or inflationary pressures, while prolonged declines could indicate deflationary risks or economic slowdowns.
Policy Formulation: Governments and central banks utilize data from the price index to formulate and adjust economic policies. For instance, if inflation exceeds a target range, central banks may increase interest rates to mitigate inflationary pressures.
Limitations and Challenges
While the National Price Level Index provides useful insights, it also comes with limitations and challenges. Here are some common issues:
Basket Composition: The market basket of goods and services may not accurately reflect individual spending patterns.
Quality Changes: Price changes may not solely reflect inflation, as they can also result from improvements or variations in the quality of goods and services.
Substitution Bias: The price index may not account for consumers’ ability to substitute cheaper alternatives when prices rise, potentially overstating inflation.
Why Use ERI Economic Research Institute’s Data?
The National Price Level Index is a helpful addition to understanding geographic differentials, serving as a supplemental tool for economists, policymakers, businesses, and consumers alike. By tracking changes in price levels over time in different countries, this index offers valuable insights into inflation, purchasing power, and overall economic health. However, it is important to recognize their limitations and interpret the data judiciously to make informed decisions and policies that promote economic stability and growth.
ERI’s Assessor Platform provides professionals with data-driven insights to understand the cost of labor and cost of living in multiple locations, including countries outside of the U.S. and Canada. Utilize and customize our Assessor Platform applications, such as the Geographic Assessor, to better comprehend geographic differentials and make well-informed business decisions.
Master List of Price Level Index by Country
Country
Value
YOY % Change
Albania
42.6
8.6
Argentina
45.8
-0.3
Australia
87.9
-2.5
Austria
81.3
5.8
Belgium
80.6
5.8
Brazil
45.8
-0.8
Bulgaria
45.4
8.1
Cabo Verde
46.4
-0.9
Cameroon
32.7
3
Canada
82.1
-2.3
Chile
47.6
3
China
47.3
-3.6
Colombia
36.5
3.1
Costa Rica
59.1
-1
Croatia
52.7
8.4
Cyprus
64.3
4.7
Czechia
59
6.7
Denmark
91.9
4.7
Estonia
65.8
5.5
Finland
84.4
3.4
France
76
3.1
Georgia
32.7
-1.1
Germany
79.7
5.1
Greece
59.1
5.9
Hong Kong SAR
71.9
1.7
Hungary
51.6
7.5
Iceland
114.7
11.6
India
23.1
-5.5
Indonesia
28.7
-4.2
Ireland
84.4
5.2
Israel
100.7
6.4
Italy
68.5
5.5
Japan
63.5
1.7
Korea
57.1
-3.9
Latvia
56.6
5.3
Lithuania
56.9
7
Luxembourg
93.6
6
Madagascar
28.9
2.9
Malta
65.9
4.8
Mexico
52.4
-3.2
Morocco
39.9
3.4
Netherlands
83.7
5.7
New Zealand
85.8
-3.2
North Macedonia
34.5
0.5
Norway
86.7
1.9
Poland
51.9
6
Portugal
59.9
7.2
Romania
43.7
6.7
Russia
31.4
-1.8
Saudi Arabia
46.6
-5.3
Senegal
35
-1.6
Serbia
41.7
0.9
Singapore
60.2
1.3
Slovak Republic
57.5
5.8
Slovenia
62.6
5
South Africa
41.5
2.4
Spain
64
5.1
Sweden
86.5
7.6
Switzerland
111.3
0.7
Turkey
38.4
9.1
United Kingdom
88.2
3.9
United States
100
0
Zambia
28.2
-13.7
Table 1: National Price Level Index Master List – This table reflects the National Price Level Index by country. Data are updated as of April 28, 2026. Base reference: U.S. Average = 100
Since 1989, ERI has utilized the latest technology and statistical methods to automate compensation tasks to save subscribers time and money. At ERI, our approach to artificial intelligence (AI) is rooted in practical solutions that solve real world challenges. We have initiatives in three areas: reducing time spent on repetitive tasks, improving data accuracy, and enhancing decision-making in complex compensation work.
Our philosophy is simple: AI should make professionals more effective and strategic. It should amplify expertise, ensure consistency, and uncover insights that would otherwise remain hidden in data. To this end, ERI has developed a suite of AI-powered features, including AI-Generated Job Descriptions, to help HR professionals efficiently and accurately manage compensation.
What Is a Job Description?
As defined in ERI’s guide, “How to Write Job Descriptions That Optimize Your Workforce,” a job description is a Human Resources instrument that explains the who, what, when, where, why, and how of a job. The job description explains a job’s placement within an organization and outlines the essential duties and typical functions performed by an incumbent. A thorough job description should answer these questions:
Who is this person within the organization?
Why does this job exist?
What duties does this job entail?
How are these duties performed?
When are these duties performed?
Where are these duties performed?
A job description traditionally begins with a job analysis, which entails researching and surveying a position to discover and extensively document facts about a job. The job analysis can also lead to gathering valuable data detailing the expected level of working knowledge, skills, and abilities required to perform the essential duties. The completed job description document serves as the official record for a job – the result of a thorough job analysis, discovering the technical aspects that characterize a role.
Why Are Job Descriptions Important?
The job content ascertained from a job analysis provides line of sight to specific job responsibilities, business context, and connections with other jobs. The end result is a job description, which HR and compensation professionals can use in various contexts. Whether the focus is employment law and compliance, organization culture, or total rewards and performance management, having knowledge and access to accurate, detailed job descriptions is essential.
Job descriptions are relied upon for myriad decisions, from setting performance standards, training plans, and career development plans to staffing decisions and organization development. These descriptions communicate the details of jobs to an array of important stakeholders. Most organizations collect job content information that explains the allocation of effort and time spent on specific duties and responsibilities. The use of this data has far reaching implications, such as recruitment, mentoring and coaching, organization effectiveness, compliance, and FLSA overtime exemption assignment, to name a few.
What Are the Benefits of AI-Generated Job Descriptions?
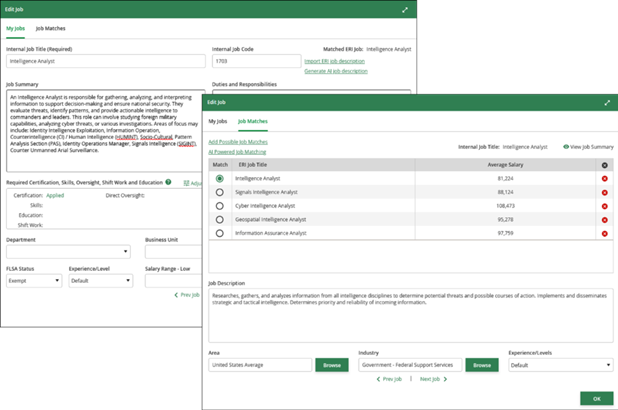
Collecting job content information from scratch and then writing job descriptions by hand can be incredibly time consuming and prone to inconsistencies. Job descriptions often rely on individual judgment to interpret the roles and responsibilities of each job. This subjectivity can lead to inaccurate or incomplete job descriptions, a problem that can trickle down to impact job matching, benchmarking, pay equity, and more. ERI’s AI-powered job description writing tool solves this problem by objectively analyzing the language and context of each job, ensuring consistent, data-backed descriptions of each unique role.
ERI’s AI-Generated Job Descriptions leverage the efficiency of modern artificial intelligence with an extensive job content database. By analyzing the detailed descriptions in ERI’s robust salary survey database, spanning over 35 years of occupational data research and best practices, our platform captures the true meaning and context behind each position. Backed by our research expertise, each job description includes comprehensive detail, with the specific duties, responsibilities, requirements, and scope of work tailored to each job title, even for niche roles. What’s more, ERI’s AI-Generated Job Descriptions can be edited easily and customized to the specific needs of each organization.
As organizations grow to include employees across diverse landscapes, ERI’s AI Job Description tool ensures consistency at scale. Rather than aggregating job descriptions analyzed and written by HR and compensation professionals in disparate locations, potentially resulting in inconsistencies and inaccuracies, our AI-powered platform standardizes terminology and descriptions across teams with varying functions and geographic contexts. This results in faster, more accurate job descriptions, helping compensation professionals make decisions with confidence and focus more on strategic planning.
Use ERI’s AI Job Description tool to effortlessly write comprehensive job descriptions that can be edited and tailored to your organization.
The Future of AI at ERI
As AI technology evolves, ERI remains focused on responsible implementation, with solutions anchored in research, data integrity, and practical applicability. Every model we build is designed to enhance clarity, consistency, and confidence for compensation professionals.
At its core, ERI’s AI strategy is about augmenting expertise with intelligence by combining decades of compensation knowledge with modern AI innovation to solve real-world problems with accuracy and insight.