ERI Economic Research Institute recently released its 2026 Benefits Benchmarking Survey, providing an invaluable resource to organizations in the process of building and updating competitive employee benefits packages. In addition to a comprehensive analysis of health care benefits, this 19th edition of the survey includes detailed sections on life and disability insurance, paid time off, retirement, and executive prerequisites. Participation was solicited from employers in the public, private, and nonprofit sectors, as well as government entities in the United States. Data cuts are provided by organization sector, industry group, organization size (number of employees), and geographic region.
Overview
While health care continues to be the primary and most expensive employee benefit, there are myriad other benefits to consider in an employee’s total compensation package. Having a well-rounded and clearly communicated benefits package can give an organization an edge to both recruit and retain top talent. Knowledge of the marketplace is powerful, and the ability to benchmark one’s benefits practices with those of other employers in the external marketplace is the first step in evaluating the effectiveness of current and future benefits strategies.
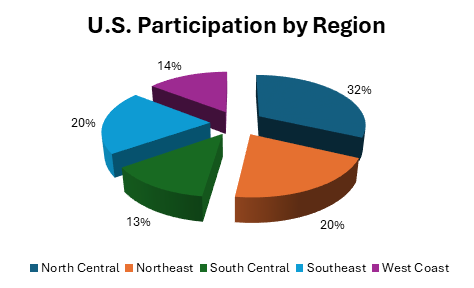
Benchmarking employer-provided employee benefits is the focus of ERI’s 2026 Benefits Benchmarking Survey. Selected findings based on this year’s survey are presented below, along with some trend information that may be influenced by the mix of survey participants from year to year. Sixty-nine (69) data submissions representing 564,433 employees were received from participants in this survey. Representation by region in the United States is as follows:
General Benefits
Sixty-seven percent (67%) of the respondents supplied information on the overall cost of benefits as a percentage of payroll. Of the responding organizations, 63% reported the cost of benefits for executive officer(s) at less than 25% of payroll. Thirty-three percent (33%) reported the cost of exempt employees’ benefits at less than 25% of payroll. Forty-three percent (43%) reported the cost of nonexempt employees’ benefits at less than 25% of payroll.
The top five employee programs offered by respondents that fall outside the scope of health insurance, life insurance, disability, retirement, and paid time off are paid holidays at 96%, holiday parties at 78%, hybrid workplace at 75%, full-time business casual policy at 67%, and remote workplace at 65%. Forty-five percent (45%) of respondents reported that part-time employees are not eligible for benefits, including paid time off. Eighty-three percent (83%) of respondents reported that retired employees are not eligible for benefits.
General Health Care Practices
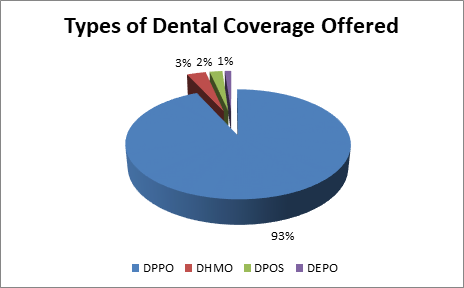
Most organizations understand the value of providing well-rounded health care coverage that includes medical, dental, and vision benefits. Sixty-seven (67) respondents offered at least one medical plan to full-time employees. Two of the sixty-nine respondents did not offer dental benefits, and three did not offer vision benefits. Of the fifty-one (51) respondents offering details of vision benefits, three included vision as part of the medical plan. The most prevalent primary medical plan offered was a Preferred Provider Organization (PPO) plan, and the most prevalent dental plan offered was a Dental Preferred Provider Organization (DPPO) plan.
With the cost of health care constantly increasing, organizations need to strike the right balance between cost-saving methods and the provision of attractive benefits that retain and motivate employees. Forty-six percent (46%) of respondents reported increasing employee contributions to premiums as a cost-saving measure. Nineteen percent (19%) of respondents introduced a health promotion and/or wellness program as a cost-saving measure. Twenty percent (20%) of the respondents moved drugs off their prescription drug formulary.
Medical Benefits
Eligibility for health care benefits and the type(s) of medical benefits offered to employees are critical decisions for all organizations. Thirty-nine percent (39%) of respondents reported that executives become eligible for health care benefits immediately upon employment and, similarly, 39% of participants reported the same eligibility for exempt employees. Slightly fewer respondents, specifically, 38% of participants, reported that nonexempt employees become eligible for health care benefits immediately upon employment.
This year, the two most popular plan types amongst eligible employees enrolled in health care plans were the Exclusive Provider Organization (EPO), enrolling 51% of employees, and Preferred Provider Organization (PPO), enrolling 43% of employees, followed by Health Maintenance Organization (HMO) plans at 5% and Point-of-Service (POS) at 1%.
Keeping track of current trends in employer-provided medical benefits can be immensely valuable as organizations strive to strike the right balance between employee and employer costs. The average monthly employee cost for Preferred Provider Organization plans for employee-only coverage was $153.41, up from $144.89 in 2025 but still lower than $159.94 in 2015. The employer cost for employee-only coverage for Preferred Provider Organization plans equaled 81%, the same as in 2025. In this year’s survey, the average deductible reported in a High-Deductible Health Plan (HDHP) arrangement was $2,841, down from $3,102.00 in 2025.
Many medical plans offer an array of provisions beyond the typical health care benefits that employees have come to expect. Most medical plans offered some form of wellness and/or disease management programs to participants. Fifty-three percent (53%) of plans provide an Employee Assistance Plan (EAP), while 15% offer Complementary and Alternative Medicine (CAM) provisions.
Life and Disability Insurance
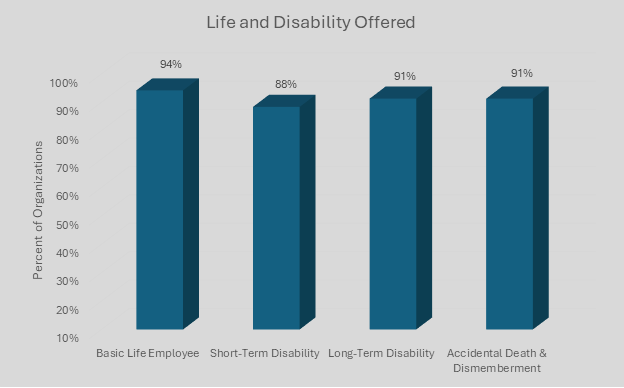
When employees face accidents, short- and long-term illnesses, and death, life and disability insurance become essential, making these benefits commonplace in most organizations. Ninety-four percent (94%) of respondents offered some form of basic life insurance to employees. Eighty-seven percent (87%) offered supplemental life insurance and 80% of respondents offered supplemental dependent life insurance. Ninety-one percent (91%) of respondents offered long-term disability insurance and 88% offered short-term disability insurance.
Employee Leave Practices
How organizations administer time off for employees can be a complicated decision, particularly as employees increasingly value a healthy work-life balance. Fifty-five percent (55%) of respondents offered traditional leave plans that typically consist of vacation, sick time, bereavement, personal leave, holidays, and floating holidays. The average number of fixed holidays among respondents was nine days per year. Forty-five percent (45%) of respondents used a pooled-leave system that combines all or part of paid leave into one pool. The average number of days granted at one year of service in reported pooled-leave plans was eighteen days. The average number of days granted at 10 years of service in reported pooled-leave plans was 30 days. Ease of administration was the most common reason given for using a pooled-leave system.
Retirement
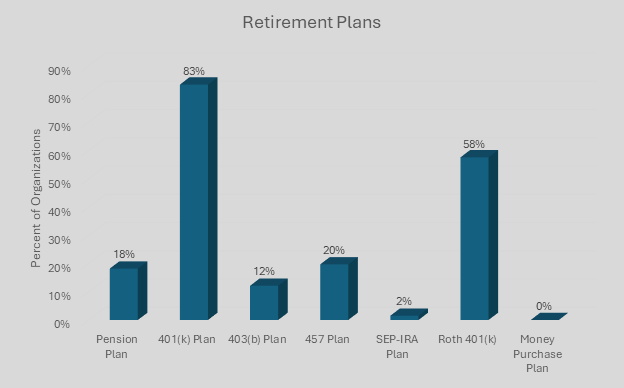
Saving for retirement is essential for employees of all ages, so the retirement benefits offered by organizations are an important piece in an employee’s overall total compensation package. Sixty-six (66) of the 69 respondents offered some type of retirement plan to employees. Eighty-three percent (83%) of the organizations providing a retirement plan offered a 401(k) plan. The most common form of vesting schedule in reported defined contribution plans was 100% immediate vesting.
Executive Perquisites
In a highly competitive market for top-tier executive talent, organizations often include executive perks, including financial and non-financial benefits, in their executive compensation packages. Sixty-seven percent (67%) of respondents offered at least one executive perquisite. The five most prevalent executive perquisites included association or professional society dues/membership, conference travel expenses, conference registration fees, car or car allowance, and relocation expenses.
To drill down on actual costs and further details on employer-provided employee benefits in today’s competitive marketplace, please see the full 2026 Benefits Benchmarking Survey report, which is available for purchase by contacting ERI at [email protected] or 1-800-627-3697. For more information on this important annual survey, including the opportunity to participate in next year’s survey, please visit www.erieri.com/salarysurveys/benefits.
How Can ERI Help?
Building a competitive employee benefits package that attracts, retains, and motivates employees, while aligning with an organization’s budgetary requirements, is critical for organizations of all sizes. HR and compensation professionals need to stay on top of current trends in employee benefits with data customized to reflect comparable organizations in their market. ERI’s Benefits Benchmarking Survey provides an in-depth report of employer-provided employee non-cash benefits from a broad range of participating organizations, with actual costs and coverage details reported by organization sector (privately and publicly owned for-profit, nonprofit, and government organizations), industry group, organization size (number of employees), and geographic region.
For a broader analysis, the Benefits solution in ERI’s Salary Assessor provides a robust database of employee benefits data, including information contributed by the Benefits Benchmarking Survey and additional sources of employer-reported data, in an easy-to-use online platform that helps you quickly drill down on the data you need and export customized reports.
Beyond benchmarking employee benefits data from comparable organizations, HR and compensation professionals need to carefully design, administer, communicate, and maintain their benefits plans. Using the Compensation Management solution in ERI’s Salary Assessor, organizations can efficiently and effectively manage all aspects of their employee benefits packages, including budget adherence and ongoing annual reviews. ERI’s Total Rewards Statement provides a complete breakdown of individual employee pay with employee and employer contributions to optional and mandated benefits, helping organizations communicate their benefits decisions to both stakeholders and employees. ERI is here to help you with all the steps involved in building a competitive employee benefits package, saving you time while ensuring accuracy.
For more information about ERI’s Assessor Platform, please sign up for a guided tour and let us show you how we can help you create and maintain a competitive benefits package tailored to your organization.