United States and Canada Minimum Wage Updates – July 2026


A sample of city, county and state/province North American minimum wage changes found in ERI’s Geographic Assessor is provided below.

To learn more about how we gather this data please visit our Minimum Wage page.


City Changes

Chicago, Illinois minimum wage will increase to $17.05 (effective 7/1/2026)

Chicago, Illinois minimum wage for tipped workers will increase to $12.96 (effective 7/1/2026) *

San Francisco, California minimum wage will increase to $19.61 (effective 7/1/2026)

County Changes

Cook County, Illinois minimum wage will increase to $15.40 (effective 7/1/2026) *

Cook County, Illinois minimum wage for tipped workers will increase to $9.25 (effective 7/1/2026) *

Howard County, Maryland minimum wage for workers of small business will increase to $16.00 (effective 7/1/2026) *


* For additional details like business size definitions, hotel employee definitions, tipped employee definitions, additional and upcoming rates, or links to source references please see the Minimum Wage tab in the Geographic Assessor.

 

June 2026 Updates

City Changes

Glendale, California minimum wage for hotel workers will increase to $25.00 (effective 7/1/2026) *

Los Angeles, California minimum wage for hotel and airport workers will increase to $25.00 (effective 7/1/2026) *

Santa Monica, California minimum wage for hotel workers will increase to $25.00 (effective 7/1/2026) *

County Changes

Prince George’s County, Maryland minimum wage for service contract workers will increase to $18.10 (effective 7/1/2026) *

State/Province Changes

Alaska minimum wage will increase to $14.00 (effective 7/1/2026)

Alaska minimum wage for school bus drivers will increase to $28.00 (effective 7/1/2026) *

May 2026 Updates

City Changes

Pasadena, California minimum wage will increase to $18.57 (effective 7/1/2026)

Emeryville, California minimum wage will increase to $20.34 (effective 7/1/2026)

Portland, Oregon minimum wage will increase to $16.80 (effective 7/1/2026) *

County Changes

Oregon non-urban counties minimum wage will increase to $14.55 (effective 7/1/2026) *

State/Province Changes

Oregon standard minimum wage will increase to $15.55 (effective 7/1/2026) *

April 2026 Updates

City Changes

Los Angeles, California minimum wage will increase to $18.42 (effective 7/1/2026)

County Changes

Montgomery County, Maryland minimum wage for large employers will increase to $18.00 (effective 7/1/2026) *

Montgomery County, Maryland minimum wage for mid-size employers will increase to $16.50 (effective 7/1/2026) *

Montgomery County, Maryland minimum wage for small employers will increase to $15.95 (effective 7/1/2026) *

State/Province Changes

British Columbia minimum wage will increase to C$18.25 (effective 6/1/2026)

March 2026 Updates

City Changes

District of Columbia minimum wage will increase to $18.40 (effective 7/1/2026)

District of Columbia minimum wage for tipped employees will increase to $10.30 (effective 7/1/2026) *

Malibu, CA minimum wage will increase to $17.91 (effective 7/1/2026)

State/Province Changes

New Brunswick minimum wage will increase to C$15.90 (effective 4/1/2026)

Yukon Territory minimum wage will increase to C$18.51 (effective 4/1/2026)

February 2026 Updates

City Changes

San Diego, California minimum wage for certain hotels and amusement parks will increase to $19.00 (effective 7/1/2026) *

San Diego, California minimum wage for hospitality employers at certain event centers will increase to $21.06 (effective 7/1/2026) *

State/Province Changes

Prince Edward Island minimum wage will increase to C$17.00 (effective 4/1/2026)

Nova Scotia minimum wage will increase to C$16.75 (effective 4/1/2026)

January 2026 Updates

City Changes

Oakland, California minimum wage will increase to $17.34 (effective 1/1/2026)

Oakland, California minimum wage for hotel employees with health benefits will increase to $18.85 (effective 1/1/2026) *

Oakland, California minimum wage for hotel employees without health benefits will increase to $25.14 (effective 1/1/2026) *

County Changes

San Mateo, California minimum wage for workers in unincorporated county areas will increase to $17.95 (effective 1/1/2026) *

State/Province Changes

New York minimum wage will increase to $16.00 (effective 1/1/2026)

New York minimum wage for tipped employees will increase to $13.30 (effective 1/1/2026) *

New York minimum wage for tipped food service employees will increase to $10.70 (effective 1/1/2026) *

December 2025 Updates

City Changes

Cupertino, California minimum wage will increase to $18.70 (effective 1/1/2026)

Portland, Maine minimum wage will increase to $16.75 (effective 1/1/2026)

County Changes

Boulder, Colorado minimum wage for workers in unincorporated county areas will increase to $16.82 (effective 1/1/2026) *

Boulder, Colorado minimum wage for tipped workers in unincorporated county areas will increase to $13.80 (effective 1/1/2026) *

State/Province Changes

Rhode Island minimum wage will increase to $16.00 (effective 1/1/2026)

November 2025 Updates

City Changes

Flagstaff, Arizona minimum wage will increase to $18.35 (effective 1/1/2026)              

San Diego, California minimum wage will increase to $17.75 (effective 1/1/2026)

Seattle, Washington minimum wage will increase to $21.30 (effective 1/1/2026)

State/Province Changes

Washington state minimum wage will increase to $17.13 (effective 1/1/2026)

Washington state minimum wage for minors will increase to $14.56 (effective 1/1/2026) *

October 2025 Updates

City Changes

Denver, Colorado minimum wage will increase to $19.29 (effective 1/1/2026)

Denver, Colorado minimum wage for tipped workers will increase to $16.27 (effective 1/1/2026) *

State/Province Changes

Manitoba minimum wage will increase to C$16.00 (effective 10/1/2025)

Saskatchewan minimum wage will increase to C$15.35 (effective 10/1/2025)

California minimum wage will increase to $16.90 (effective 1/1/2026)

September 2025 Updates

City Changes

Long Beach, California minimum wage for concessionaire workers will increase to $25.00 (effective 10/1/2025) *

State/Province Changes

Nova Scotia minimum wage will increase to C$16.50 (effective 10/1/2025)

Ontario minimum wage will increase to C$17.60 (effective 10/1/2025)

Prince Edward Island minimum wage will increase to C$16.50 (effective 10/1/2025)
August 2025 Updates

State/Province Changes

Northwest Territories minimum wage will increase to C$16.95 (effective 9/1/2025)

Nunavut minimum wage will increase to C$19.75 (effective 9/1/2025)

Florida minimum wage will increase to $14.00 (effective 9/30/2025)

Florida minimum wage for tipped workers will increase to $10.98 (effective 9/30/2025) *

July 2025 Updates

City Changes

Alameda, CA minimum wage will increase to $17.46 (effective 7/1/2025)

Chicago, IL minimum wage will increase to $16.60 (effective 7/1/2025)

Chicago, IL minimum wage for tipped workers will increase to $12.62 (effective 7/1/2025) *

Chicago, IL minimum wage for youth workers will increase to $16.50 (effective 7/1/2025) *

County Changes

Los Angeles, CA minimum wage for unincorporated areas will increase to $17.81 (effective 7/1/2025) *

June 2025 Updates

City Changes

Portland, Oregon minimum wage will increase to $16.30 (effective 7/1/2025) *

County Changes

Oregon nonurban counties minimum wage will increase to $14.05 (effective 7/1/2025) *

State/Province Changes

British Columbia minimum wage will increase to C$17.85 (effective 6/1/2025)

Oregon standard minimum wage will increase to $15.05 (effective 7/1/2025) *

May 2025 Updates

City Changes

Fremont, CA minimum wage will increase to $17.75 (effective 7/1/2025)

San Francisco, CA minimum wage will increase to $19.18 (effective 7/1/2025)

San Francisco, CA minimum wage for government supported employees will increase to $16.97 (effective 7/1/2025) *

State/Province Changes

Québec minimum wage will increase to C$16.10 (effective 5/1/2025)

Québec minimum wage for tipped employees will increase to C$12.90 (effective 5/1/2025) *

April 2025 Updates

City Changes

Bellingham, WA minimum wage will increase to $18.66 (effective 5/1/2025)

County Changes

Montgomery County, MD minimum wage for large businesses will increase to $17.65 (effective 7/1/2025)*

Montgomery County, MD minimum wage for mid-size businesses will increase to $16.00 (effective 7/1/2025)*

Montgomery County, MD minimum wage for small businesses will increase to $15.50 (effective 7/1/2025)*

State/Province Changes

Yukon Territory minimum wage for will increase to C$17.94 (effective 4/1/2025)

March 2025 Updates

City Changes

Los Angeles, CA minimum wage will increase to $17.87 (effective 7/1/2025)

County Changes

Santa Fe county, NM minimum wage in unincorporated areas will increase to $15.00 (effective 3/1/2025)

Santa Fe county, NM minimum wage for tipped employees in unincorporated areas will increase to $4.48 (effective 3/1/2025) *

State/Province Changes

Newfoundland and Labrador minimum wage for will increase to C$16.00 (effective 4/1/2025)

February 2025 Updates

City Changes

District of Columbia minimum wage will increase to $17.95 (effective 7/1/2025)

Bellingham, WA minimum wage will increase to $18.66 (effective 7/1/2025)

State/Province Changes

Alaska minimum wage for will increase to $13.00 (effective 7/1/2025)

Minimum Wage update

January 2025 Updates

City Changes

Oakland, CA minimum wage will increase to $16.89 (effective 1/1/2025)

Renton, WA minimum wage for large businesses will increase to $20.90 (effective 1/1/2025) *

Renton, WA minimum wage for mid-size businesses will increase to $18.90 (effective 1/1/2025) *

State/Province Changes

Missouri minimum wage for will increase to $13.75 (effective 1/1/2025)

Missouri minimum wage for tipped employees will increase $6.88 (effective 1/1/2025) *

Montana minimum wage for will increase to $10.55 (effective 1/1/2025)

ERI presents minimum wage updates for December 2024.

December 2024 Updates

City Changes

Menlo Park, CA minimum wage will increase to $17.10 (effective 1/1/2025)

Portland, ME minimum wage will increase to $15.50 (effective 1/1/2025)

Portland, ME minimum wage for tipped employees will increase to $7.75 (effective 1/1/2025) *

State/Province Changes

Alaska minimum wage will increase to $11.91 (effective 1/1/2025)

Washington state minimum wage for will increase to $16.66 (effective 1/1/2025)

ERI presents minimum wage updates for November 2024

November 2024 Updates

City Changes

Seattle, WA minimum wage for all employers will increase to $20.76 (effective 1/1/2025)

Belmont, CA minimum wage will increase to $17.95 (effective 1/1/2025)

State/Province Changes

South Dakota minimum wage will increase to $11.50 (effective 1/1/2025)

South Dakota minimum wage for tipped employees will increase to $5.75 (effective 1/1/2025) *

New Jersey minimum wage will increase to $15.49 (effective 1/1/2025)

Minimum Wage updates for October 2024 provided by ERI.

October 2024 Updates

City Changes

Denver minimum wage will increase to $18.81 (effective 1/1/2025)

Denver tipped minimum wage will increase to $15.79 (effective 1/1/2025) *

State/Province Changes

Virginia minimum wage will increase to $12.41 (effective 1/1/2025)

Rhode Island minimum wage will increase to $15.00 (effective 1/1/2025)

Minimum wage updates for September 2024 provided by ERI.

September 2024 Updates

State/Province Changes

Manitoba minimum wage will increase to C$15.80 (effective 10/1/2024)

Saskatchewan minimum wage will increase to C$15.00 (effective 10/1/2024)

Prince Edward Island minimum wage will increase to C$16.00 (effective 10/1/2024)

August 2024 Updates

State/Province Changes

Northwest Territories minimum wage will increase to C$16.70 (effective 9/1/2024)

Florida minimum wage will increase to $13.00 (effective 9/30/2024)

Florida minimum wage for tipped workers will increase to $9.98 (effective 9/30/2024) *

Ontario minimum wage will increase to C$17.20 (effective 10/1/2024)

July 2024 Updates

City Changes

Berkeley, CA minimum wage will increase to $18.67 (effective 7/1/2024)

Emeryville, CA minimum wage will increase to $19.36 (effective 7/1/2024)

Chicago, IL standard minimum wage will increase to $16.20 (effective 7/1/2024) *

Chicago, IL standard tipped minimum wage will increase to $11.02 (effective 7/1/2024) *

County Changes

Cook County, IL minimum wage will increase to $14.05 (effective 7/1/2024)

June 2024 Updates

City Changes

San Francisco, CA minimum wage will increase to $18.67 (effective 7/1/2024)

Portland, OR metro area minimum wage will increase to $15.95 (effective 7/1/2024) *

County Changes

Oregon nonurban counties minimum wage will increase to $13.70 (effective 7/1/2024) *

State/Province Changes

Nevada minimum wage will increase to $12.00 (effective 7/1/2024)

Oregon standard minimum wage will increase to $14.70 (effective 7/1/2024) *

May 2024 Updates

City Changes

Renton, WA minimum wage for large employers will increase to $20.29 (effective 7/1/2024) *

Renton, WA minimum wage for small employers will increase to $18.29 (effective 7/1/2024) *

Fremont, CA minimum wage will increase to $17.30 (effective 7/1/2024)

State/Province Changes

Puerto Rico minimum wage will increase to $10.50 (effective 7/1/2024)

April 2024 Updates

City Changes

Los Angeles minimum wage will increase to $17.28 (effective 7/1/2024)

Los Angeles minimum wage for hotel workers will increase to $20.32 (effective 7/1/2024) *

County Changes

Unincorporated Los Angeles County minimum wage will increase to $17.27 (effective 7/1/2024)

State/Province Changes

British Columbia minimum wage will increase to C$17.40 (effective 6/1/2024)

Minimum Wage Update for March 2024 From ERI

March 2024 Updates

City Changes

Santa Monica, CA minimum wage will increase to $17.27 (effective 7/1/2024)

Minneapolis, MN minimum wage for small employers will increase to $15.57 (effective 7/1/2024) *

State/Province Changes

New Brunswick minimum wage will increase to C$15.30 (effective 4/1/2024)

Québec minimum wage will increase to C$15.75 (effective 5/1/2024)

Québec minimum wage for tipped employees will increase to C$12.60 (effective 5/1/2024) *

ERI announces minimum wage update for February 2024.

February 2024 Updates

City Changes

District of Columbia minimum wage will increase to $17.50 (effective 7/1/2024)

District of Columbia minimum wage for tipped employees will increase to $10.00 (effective 7/1/2024) *

Tukwila, WA minimum wage for employees of mid-sized employers will increase to $19.29 (effective 7/1/2024) *

State/Province Changes

California minimum wage for fast food workers will increase to $20.00 (effective 4/1/2024) *

Minimum wage update 2024

January 2024 Updates

City Changes

Flagstaff, AZ minimum wage will increase to $17.40 (effective 1/1/2024) *

Flagstaff, AZ minimum wage for tipped employees will increase to $15.90 (effective 1/1/2024) *

County Changes

Cook County, IL minimum wage will increase to $14.00 (effective 1/1/2024)

Cook County, IL minimum wage for tipped employees will increase to $8.40 (effective 1/1/2024) *

State/Province Changes

Maryland minimum wage will increase to $15.00 (effective 1/1/2024)

Maryland minimum wage for youth employees will increase to $12.75 (effective 1/1/2024) *

Montana minimum wage will increase to $10.30 (effective 1/1/2024)

ERI announces minimum wage rates for December 2023

December 2023 Updates

City Changes

Sonoma, CA minimum wage for large employers will increase to $17.60 (effective 1/1/2024) *

Sonoma, CA minimum wage for small employers will increase to $16.56 (effective 1/1/2024) *

County Changes

Boulder County, CO (unincorporated areas only) minimum wage will come into effect at $15.69 (effective 1/1/2024)

Boulder County, CO (unincorporated areas only) minimum wage for tipped employees will come into effect at $12.67 (effective 1/1/2024) *

State/Province Changes

Arizona minimum wage will increase to $14.35 (effective 1/1/2024)

Arizona minimum wage for tipped employees will increase to $11.35 (effective 1/1/2024) *

ERI Announces Minimum Wage Rates for November 2023

November 2023 Updates

City Changes

Seattle, WA minimum wage for all large employers and for small employers whose employees do not receive a specified amount of medical benefits and tips will increase to $19.97 (effective 1/1/2024) *

Seattle, WA minimum wage for small employers whose employees do receive a specified amount of medical benefits and/or tips will increase to $17.25 (effective 1/1/2024) *

Tukwila, WA minimum wage for large employers will increase to $20.29 (effective 1/1/2024) *

Tukwila, WA minimum wage for small employers will increase to $18.29 (effective 1/1/2024) *

State/Province Changes

Ohio minimum wage will increase to $10.45 (effective 1/1/2024)

Ohio minimum wage for tipped employees will increase to $5.25 (effective 1/1/2024) *

 

15 Most Affordable Cities in the U.S.

With rising inflation and the skyrocketing cost of housing in many American cities, many employees need to think carefully about the cost of living when they consider new job offers, transfers, and opportunities for career advancement. Cost of living is also essential to HR professionals in compensation planning and is used to evaluate business or employee relocation, expansion, and remote work. To that end, ERI has compiled an Affordability Index listing the 15 most affordable major cities in the United States:

  1. Sioux Falls, South Dakota
  2. Amarillo, Texas
  3. Rochester, Minnesota
  4. Clarksville, Tennessee
  5. Huntsville, Alabama
  6. Cedar Rapids, Iowa
  7. Fargo, North Dakota
  8. Lubbock, Texas
  9. Springfield, Illinois
  10. Beaumont, Texas
  11. Minneapolis, Minnesota
  12. Oklahoma City, Oklahoma
  13. Raleigh, North Carolina
  14. Newport News, Virginia
  15. Peoria, Illinois

The Affordability Index is composed of a weighted combination of ERI’s Cost of Labor and Median Household Income versus ERI’s Cost of Living. ERI’s Cost of Labor is defined as the annual cost of labor based on the U.S. national average for an annual income of $78,000, calculated using 2025 data from ERI’s Geographic Assessor. Median Household Income is derived from the American Community Survey (ACS), an annual publication by the U.S. Census Bureau providing detailed population and housing information. ERI’s Cost of Living is defined as the annual cost of living based on the U.S. national average for an annual income of $78,000 using ERI’s defaults for family size (4 people), transportation (ownership of 2 vehicles), and a rental accommodation, calculated using 2025 data from ERI’s Geographic Assessor. A list of 261 major U.S. cities, as defined in ERI’s Geographic Assessor, were compared in this analysis, and the 15 highest-ranking cities with populations of more than 100,000 are provided in the Affordability Index above.

Understanding the cost of living between cities and affordability as compared to the national average can help HR professionals make informed decisions about relocation, salary planning, and budgeting. For a more in-depth analysis of cost of living, turn to ERI. Our Assessor Platform can help you stay on top of cost-of-living changes among cities and analyze cost-of-living differentials based on earnings level, home size, home ownership or rental, family size, number of vehicles, and automobile value. Total cost-of-living analyses include breakdowns of major expenditures, including consumables, transportation, health services, housing, tax obligations, and more. To learn more about cost-of-living analyses using ERI’s Assessor Platform, visit www.erieri.com.

References:

U.S. Census Bureau, U.S. Department of Commerce. “Median Household Income in the Past 12 Months (in 2023 Inflation-Adjusted Dollars).” American Community Survey, ACS 5-Year Estimates Detailed Tables, Table B19013, 2023, https://data.census.gov/table/ACSDT5Y2023.B19013?q=B19013&d=ACS+5-Year+Estimates+Detailed+Tables

Cost-of-Living Comparisons: Relocating to Austin, Texas

As the capital of Texas and one of the fastest-growing cities in the United States, Austin has become a popular destination for professionals seeking career opportunities, affordable living, and a high quality of life. With its rapid economic growth and booming tech industry, Austin has become a magnet for professionals in all sectors. Cities like San Francisco, New York, and Boston are known for their high cost of living, and many professionals are seeking more affordable, yet thriving, alternatives. Austin offers that balance and the city’s quality of life is a major draw.  

What Does It Cost to Relocate to Austin, Texas? 

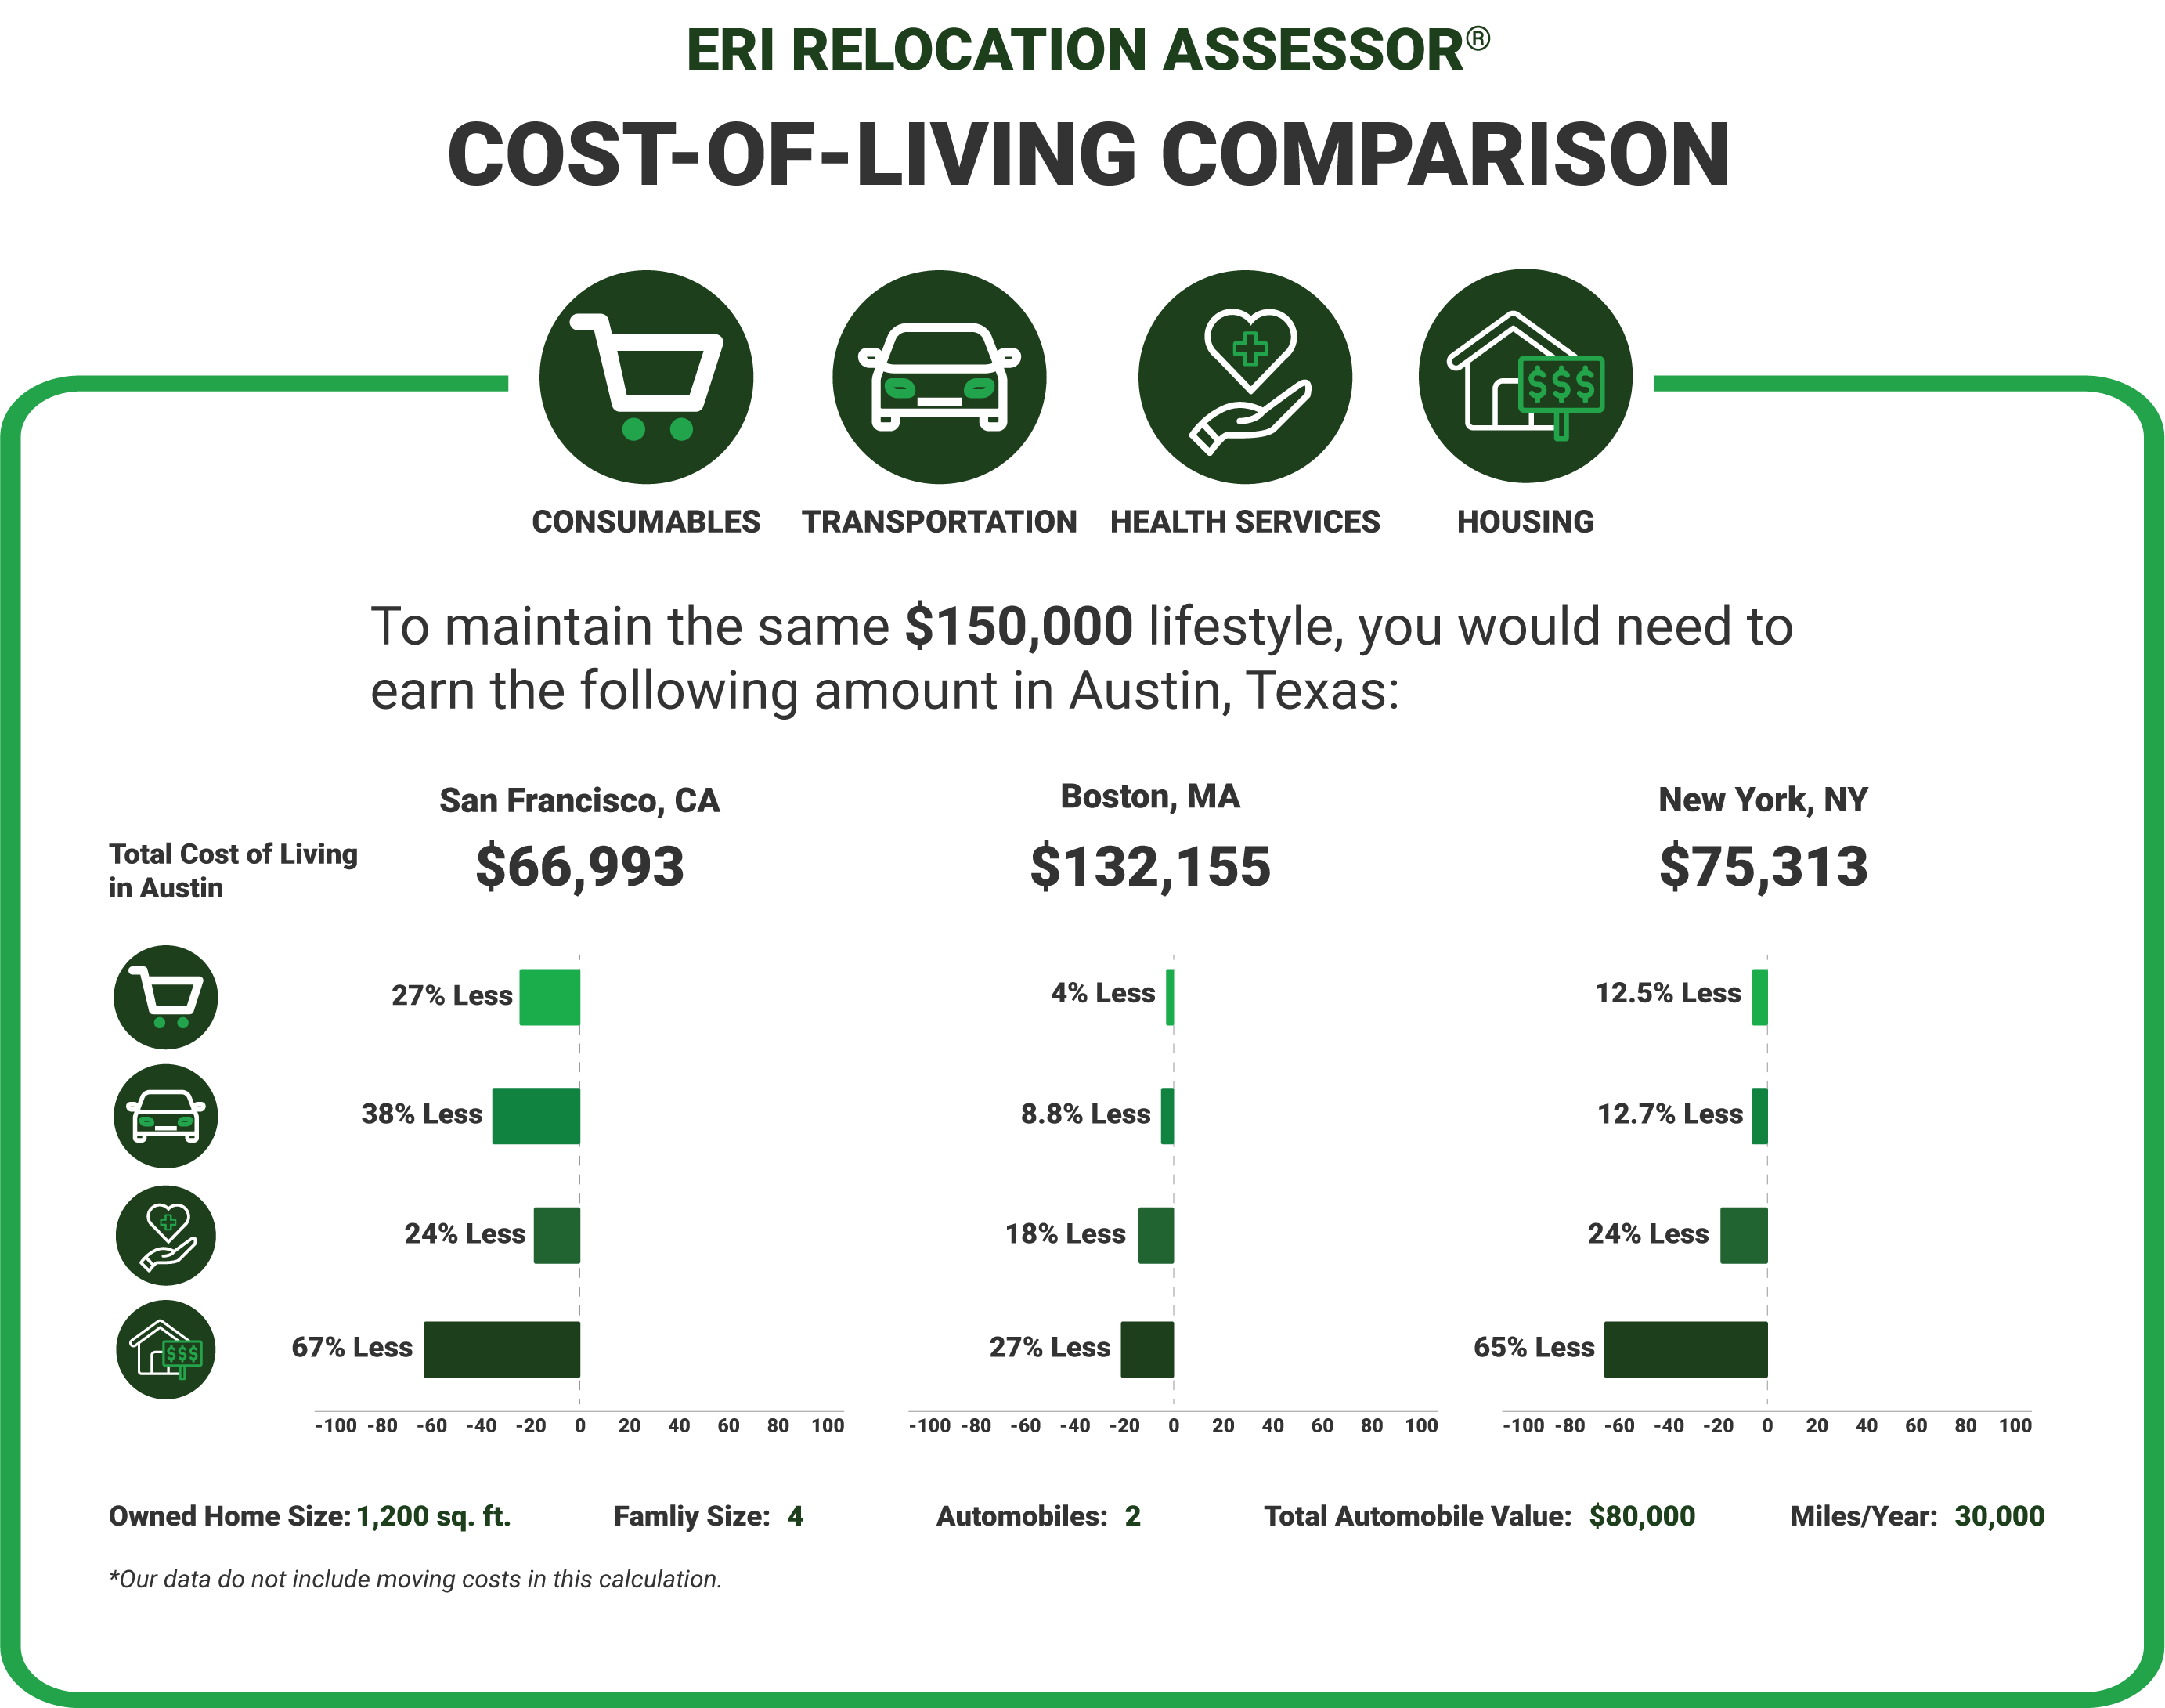
In our latest cost-of-living comparison using data from our Relocation Assessor, we examine a family of four relocating to Austin, Texas, from three other major U.S. locations. These analyses are meant as one-to-one comparisons based on replicating a typical lifestyle with an annual salary of $150,000 in each area. We assume that this family owns a 1,200 square foot home with 2 automobiles valued at $80,000. Calculations do not include moving costs. In addition to the total cost-of-living comparison, we have provided differentials for each of the major expenditure pattern components: consumables, transportation, health services, and housing. 


Cost of Living Comparison Austin Texas

Moving to Austin from California 

Replicating a typical lifestyle in San Francisco, California, earning an annual salary of $150,000 only requires you to make $66,993 in Austin, Texas. This makes Austin about 55% less expensive than San Francisco, with housing in Austin costing 67% less. Moving to Austin from California means more affordable transportation, housing, food, and health costs. 

Moving to Austin from Massachusetts  

When moving to Austin from Boston, Massachusetts, you should be making at least $132,155 to maintain the same standard of living. Housing in Austin costs 27% less than housing in Massachusetts.  

Moving to Austin from New York 

Not surprisingly, New York is significantly more expensive than Austin, Texas. With housing prices 65% higher than in Austin, you will only need to earn $75,313 to maintain the same standard of living in Austin. 

How Expensive Is It to Live in Austin, Texas? 


Cost of Living Comparison National Average

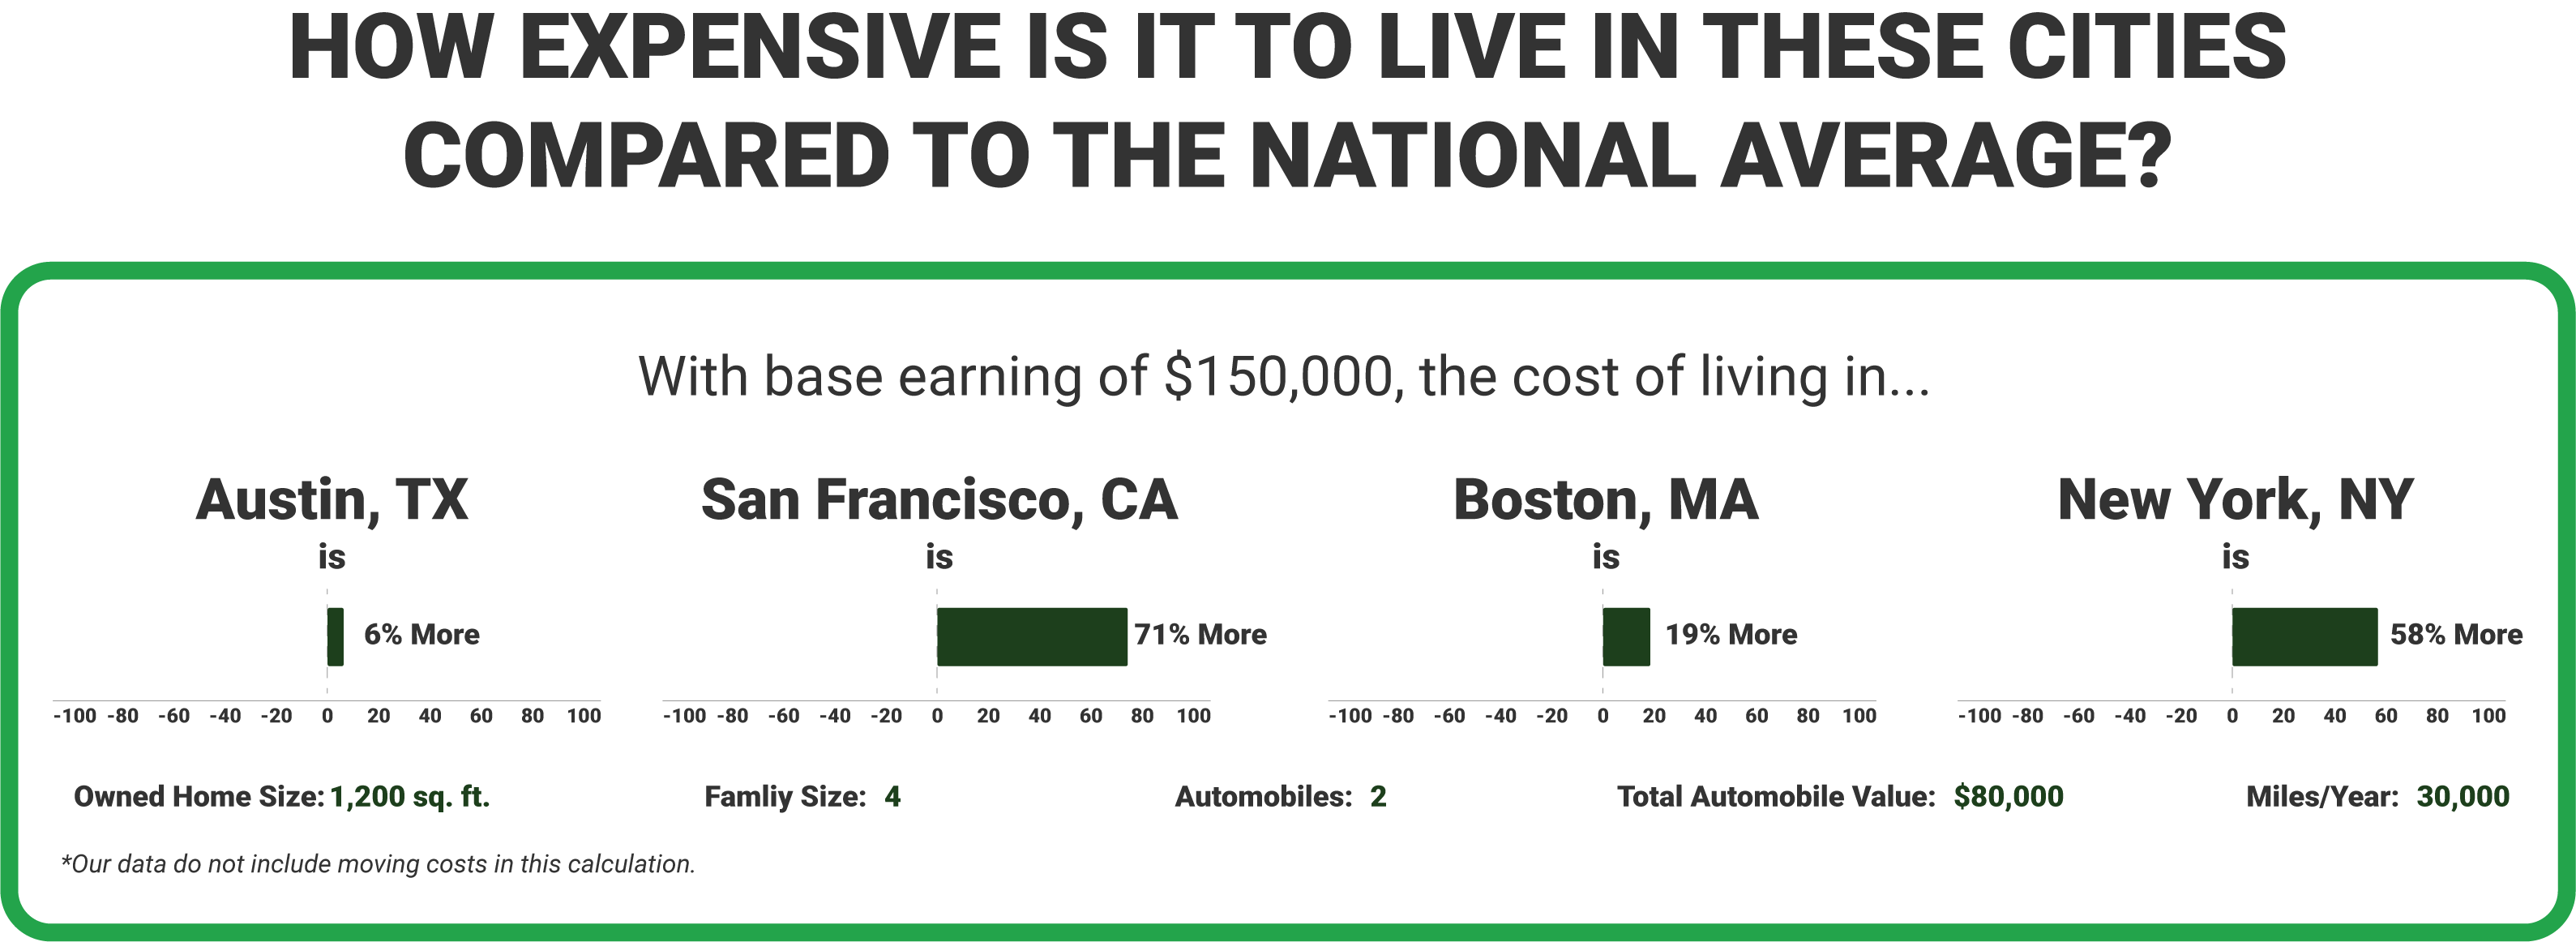
Our Austin, Texas, cost-of-living comparisons show why professionals may be seeking relocation to Austin as it offers more affordability overall compared to the other major U.S. cities. Austin is also the least expensive of the cities analyzed when comparing the cost of living to the national average. Although the cost of moving to Austin depends on a lot of factors, understanding the cost of living between cities and how expensive they are compared to the national average can help you make informed decisions on relocation, salary planning, and budgeting. 

Why Use ERI? 

Cost-of-living differentials are essential to compensation planning and are used to evaluate business or employee relocation, expansion, or remote work. Our Assessor Platform can help you easily compare cost of living among cities and analyze cost-of-living differentials based on earnings level, home size, home ownership or rental, family size, number of autos, and automobile value. 

Why Geographic Salary Differentials Are Important

Why Geographic Salary Differentials Are Important

Imagine a large employer with headquarters in Orange County, California, opening an office in Biloxi, Mississippi. The employer knows exactly what to pay employees in the Orange County market; however, the Biloxi market is unfamiliar. What assumptions should be made to evaluate the budget necessary to successfully operate in Biloxi? If the company applies the same salary range for the same type of job in Biloxi that it uses in its headquarters in Orange County, then the budget implications could be monumental given the cost of labor is vastly different in these two locations. Assuming Biloxi’s cost of labor is much lower than that of Orange County, then the same type of job in the same company would typically pay a much lower salary in Biloxi. To compete in the same labor market, whether Orange County or Biloxi, employers must diligently study the market and tweak their compensation strategies accordingly to achieve the desired results – to lead, lag, or match the going market rate – and effectively compete for talent.

Salary surveys are used to determine to what degree there are verifiable differences in competitive salary levels across labor markets, comparing industry and company size (e.g., revenue, assets, number of employees). If, on average, certain jobs in a particular city are 15% above the national average, then one can expect to pay 15% higher in salaries for those jobs in the given city. Salary ranges are then adjusted based on the data and applied accordingly to each location, facilitating perceptions of fair pay.

Geographic salary differentials, along with salary surveys, are important tools in leveling the playing field for organizations with employees in different locations. Geographic salary differentials allow translation of different labor costs from one locale to another, so that comparisons are apples to apples, creating fair and equitable compensation across labor markets. Salaries can fluctuate significantly based on where jobs are located and such factors as the rate of unemployment and the demand for and supply of a qualified labor force in the area.

Geographic pay differentials facilitate greater cost control. In the example above, if Orange County salaries are not necessary to compete for talent in the Biloxi location, then the company would realize savings by adjusting the salary range for the new location. The overall compensation philosophy and talent strategy should factor in attracting and retaining talent in premium markets, as well as managing labor costs in non-premium markets. Where practical and possible, market pricing jobs is a best practice in compensation planning.

While using geographic salary differentials can add a layer of complexity to managing pay, getting pay right must remain a top priority. “In today’s highly competitive market environment, a geographic salary structure is an excellent tool to ensure that competitive salaries are paid across a country, recognizing that jobs should be neither over-paid nor under-paid relative to their specific marketplaces. When a decision is made to recognize differences in geographic pay, it is important to implement a simplified process that is legal, market competitive, and equitable to your labor force. Geographic salary structures also ensure that jobs are market priced fairly to support a highly motivated, engaged workforce.” For more information regarding geographic salary structurers, visit erieri.com.

Comparing Salary Differentials between cities

Comparing Salaries in Different Cities Using Geographic Pay Differentials

Geographic salary differentials normalize salaries across various cities, regions, and locales based on the cost of labor. They enable one to evaluate a given salary, whether it be in San Francisco, New York City, or New Orleans. For example, an engineer living in St. Louis considers relocating to Atlanta, Los Angeles, or Nashville. How much would she have to earn in each of these cities to equate to her current salary of $95,000 in the Midwest, where the housing market and cost of living are considered affordable, based on her profession? How much would the employer in each of these cities consider as a reasonable salary offer to get her to move there and work for the organization?

How to Benchmark Geographic Wage Differentials in Competitive Markets

The employer is primarily concerned with market competitiveness. How much must the organization pay for competent labor in the current market? When and under what circumstances would it consider paying more than the market suggests? Does the company strategy include niche skills that are available through a very limited pool of candidates in a small industry or are there unlimited workers with readily available skills that translate across multiple industries? The candidate, on the other hand, will want to know about the cost of living in the cities being considered – how much money must she earn in order to afford housing, food, schools, transportation, and lifestyle. A move from the Midwest to San Francisco, where the housing market is extremely high, would require a considerable salary increase to maintain a standard of living realized in an area with a lower cost of living. The housing market in the south – New Orleans or Atlanta – might allow for a bigger house, even if the salary offered is lower. Typical salary and offer negotiations allow employers to consider offsetting the relocation expenses to ease the adjustment due to a higher cost of living. So, while an employer generally makes permanent decisions based on competition for labor, temporary cost-of-living allowances may be made for the employee to help with the relocation.

Geographic pay differentials are market-driven pay variations between geographic locations of the work performed. They are designed as a tool to create equitable compensation across labor markets, to the degree of verifiable differences in competitive salary levels across labor markets, most commonly using salary survey data. An organization’s compensation planning requires that it account for appropriate deviations in relevant labor markets, allowing for control of payroll/labor costs where it is not necessary to pay at higher levels, while ensuring adequate pay in areas where the market is much higher than the national average. Geographic salary differentials are often used to manage recruitment and retention difficulties, allowing organizations to attract and retain talent in premium markets, manage labor costs in non-premium markets, and facilitate perceptions of equitable pay.

Where the role or incumbent is located has a significant impact on determining base pay levels. Even though consideration of multiple geographic areas may add complexity in pay management, base pay is driven by location since pay reflects the cost of labor of the local market. Geographic differentials may be applied for specific cities, or cities with similar differentials may be grouped into geographic tiers. While market pricing jobs by city is considered a best practice for assigning locations to geographic pay differentials, it is not always practical or possible to use market data by city. As an alternative, companies may create geographic pay differentials using a particular region or by grouping locations with similar market rates.

Organizations must consider alignment with the overall compensation philosophy and talent strategy. Local pay structures create a layer of complexity but, in general, ease administration and manager discretion. As employees move between locations, their salaries are adjusted to reflect ranges in the locations. To manage pay structures, companies need to determine how often they will review differential data to adjust ranges and pay inequities, annually at minimum. Additionally, they need to consider human resources information system (HRIS) implications for changing and maintaining multiple pay structures.

Wage Differential Example

The engineering company mentioned above has its headquarters located in St. Louis with offices/branches in the cities indicated in the table below. The candidate considers relocating to one of the branch locations. Using salary survey data, the following observations have been made:

Comparing pay differentials between cities.

From the data, base salary can be established, based on differentials, and used to determine appropriate, fair, and equitable salaries for the candidate in each location, assuming 100% of the market value in terms of experience, skills, and knowledge:

Comparing pay differentials between cities.

If labor supply is short in some areas, jobs will reflect that. The candidate is free to negotiate salary and offer package (e.g., bonus potential, relocation, etc.). There are no strict guidelines, so the organization may choose to continue the current salary even though a lower one is indicated (as in Atlanta and Nashville) but increase it for large cities with high costs of living (as in Los Angeles). The compensation strategy should reflect what the company wants to pay in relation to what the market and competitors for talent are paying for jobs in each location.

Geographic Pay Differentials: Practices in Managing Pay Between Locations

For companies operating in different states, an effective compensation planning strategy includes a comparison of relevant labor markets for pay differentials based on geographic locations of the work. Geographic differentials are market-driven pay variations between locations. One of the most important overall planning strategies is to create equitable compensation across labor markets for the entire workforce. There could be far-reaching budget implications if compensation planning does not account for the appropriate deviations in relevant labor markets. The objective is to control costs where it is not necessary to pay at higher levels or to ensure adequate pay in areas where the market is much higher than the national average.  Creating and adopting the use of geographic pay differentials may be needed to recognize recruitment and retention difficulties.

The standard for decisions about implementing geographic pay differentials is the degree to which there are verifiable differences in competitive salary levels across labor markets.  The location of the role or incumbent has an impact on determining base pay levels.  Geographic differentials enable organizations to attract and retain talent in premium markets, manage labor costs in non-premium markets, and facilitate perceptions of equitable pay.  However, it may add complexity in pay management if there are multiple geographic locations involved.

How to Calculate Geographic Pay Differentials

Base pay is driven by location as pay reflects the cost of labor of the local market. Geographic differentials may be applied for specific cities, or cities with similar differentials may be grouped into geographic tiers.  While market pricing jobs by city is considered a best practice for assigning locations to geographic pay differentials, it is not always practical or possible to use market data by city.  As an alternative, companies create geographic pay differentials using a particular region or by grouping locations with similar market rates. 

Organizations need to consider whether or not this approach aligns with the overall compensation philosophy and talent strategy.  Local pay structures create a layer of complexity but, in general, ease administration and manager discretion. As employees move between locations, their pay rates are adjusted to reflect their new location’s range.  To manage pay structures, companies will need to determine how often they will review differential data to adjust ranges and pay inequities, annually at minimum. In addition, they will need to consider HRIS implications for changing and maintaining multiple pay structures.

Example:

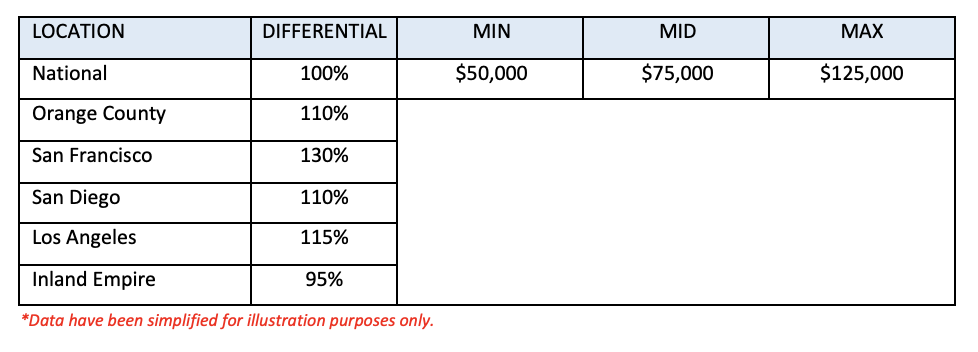
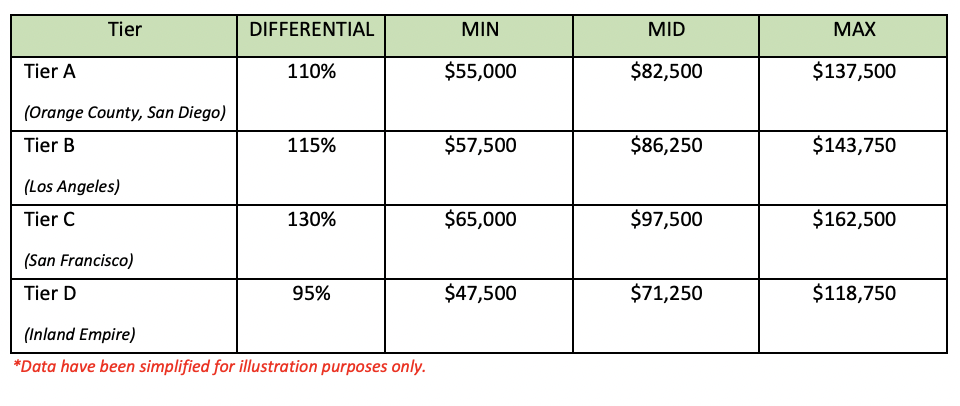
The company has its headquarters located in Orange County with offices/branches in the cities indicated in the table below.  Each office posts a position for an Accountant. Using salary survey data and geographic locators, the following observations have been made:

From the data, separate base salary structures are created by grouping together similar markets based on differentials.  This is then used to determine appropriate, fair, and equitable salaries for candidates in each location.

If the labor supply is short in some areas, jobs will reflect that.  As noted earlier, regular review of the salary structures and jobs is necessary to maintain competitive wage ranges when the workforce is spread across cities, states, or the country.  The compensation strategy should reflect where the company wants to pay in relation to what the market (and the competition for talent) is paying for jobs in each location. The illustration provided is based on creating structures for jobs that are recruited in the local area.  Higher level jobs (i.e., executives, directors, and senior managers) typically are sourced nationally and require consideration of other factors, such as industry, annual revenue, and number of employees.  These factors will vary by job.

ERI’s Geographic Assessor makes it easy to calculate the geographic cost of labor differentials. Use the geographic wage differential data to set branch office salary structures, calculate adjustments for cost of living differences, and more. Visit ERI to learn more about how to design geographic salary differentials and how to properly set pay in different locations.