15 Most Affordable Cities in the U.S.

With rising inflation and the skyrocketing cost of housing in many American cities, many employees need to think carefully about the cost of living when they consider new job offers, transfers, and opportunities for career advancement. Cost of living is also essential to HR professionals in compensation planning and is used to evaluate business or employee relocation, expansion, and remote work. To that end, ERI has compiled an Affordability Index listing the 15 most affordable major cities in the United States:

  1. Sioux Falls, South Dakota
  2. Amarillo, Texas
  3. Rochester, Minnesota
  4. Clarksville, Tennessee
  5. Huntsville, Alabama
  6. Cedar Rapids, Iowa
  7. Fargo, North Dakota
  8. Lubbock, Texas
  9. Springfield, Illinois
  10. Beaumont, Texas
  11. Minneapolis, Minnesota
  12. Oklahoma City, Oklahoma
  13. Raleigh, North Carolina
  14. Newport News, Virginia
  15. Peoria, Illinois

The Affordability Index is composed of a weighted combination of ERI’s Cost of Labor and Median Household Income versus ERI’s Cost of Living. ERI’s Cost of Labor is defined as the annual cost of labor based on the U.S. national average for an annual income of $78,000, calculated using 2025 data from ERI’s Geographic Assessor. Median Household Income is derived from the American Community Survey (ACS), an annual publication by the U.S. Census Bureau providing detailed population and housing information. ERI’s Cost of Living is defined as the annual cost of living based on the U.S. national average for an annual income of $78,000 using ERI’s defaults for family size (4 people), transportation (ownership of 2 vehicles), and a rental accommodation, calculated using 2025 data from ERI’s Geographic Assessor. A list of 261 major U.S. cities, as defined in ERI’s Geographic Assessor, were compared in this analysis, and the 15 highest-ranking cities with populations of more than 100,000 are provided in the Affordability Index above.

Understanding the cost of living between cities and affordability as compared to the national average can help HR professionals make informed decisions about relocation, salary planning, and budgeting. For a more in-depth analysis of cost of living, turn to ERI. Our Assessor Platform can help you stay on top of cost-of-living changes among cities and analyze cost-of-living differentials based on earnings level, home size, home ownership or rental, family size, number of vehicles, and automobile value. Total cost-of-living analyses include breakdowns of major expenditures, including consumables, transportation, health services, housing, tax obligations, and more. To learn more about cost-of-living analyses using ERI’s Assessor Platform, visit www.erieri.com.

References:

U.S. Census Bureau, U.S. Department of Commerce. “Median Household Income in the Past 12 Months (in 2023 Inflation-Adjusted Dollars).” American Community Survey, ACS 5-Year Estimates Detailed Tables, Table B19013, 2023, https://data.census.gov/table/ACSDT5Y2023.B19013?q=B19013&d=ACS+5-Year+Estimates+Detailed+Tables

A Look into Labor Market Trends: ERI’s April 2025 National Compensation Forecast

With a dynamic labor market and increasingly uncertain economic conditions, many HR professionals are turning to compensation forecasts to plan and manage compensation in 2025. To meet those needs, ERI examines the rates at which compensation has increased  each quarter and provides guidance on expected increases for the upcoming year in a quarterly National Compensation Forecast. These rates are calculated using ERI’s Salary Assessor and ERI’s Salary Increase Survey & Forecast. This blog post will highlight some findings from ERI’s latest National Compensation Forecast released in April 2025.

To explore labor market and overall economic conditions, ERI’s National Compensation Forecast offers insights into these indicators:

  • Open jobs rate
  • Hires rate
  • Quits rate
  • Unemployment rate
  • Inflation rate

Job Openings Rate vs. Hires Rate

An examination of the current number of job openings indicates a high number of open jobs in the United States, with a job openings rate of 4.6%, which is lower than the 10-year average open job rate of 4.8%. It is also down significantly from the high of 7.3% in March 2022. The rate of hires is currently 3.4%, which has been slowly trending down since the high of 4.4% in March 2022. This gives us a current gap between open jobs and hires of 1.2%, which closed from its highest point of 2.9% in March 2022. The 15-year gap between hires and open jobs is 0.41%, so the gap between hires and open jobs remains above average. The chart below shows the historical difference between the rate of open jobs in the economy and the rate at which employees are hired. A gap between the number of open jobs and the number of employees who are hired indicates that organizations are not able to hire all the employees that they would like. This can lead to organizations needing to raise compensation rates to hire the employees that they need.

Quits Rate

Employees are currently quitting at a rate of 2.1%, which is down from the high of 2.9% in April 2022 and below the 10-year average of 2.29%. This rate is also unchanged since the January 2025 National Compensation Forecast. The gap between the job openings and hires rates, along with fewer people quitting, are now below long-term trends, which points towards slower rates of compensation growth.

Unemployment Rate

The unemployment rate is currently 4.1%, which is up from the low of 3.5% reported in July 2022 but still considered full employment.  Full employment, which means that just about everyone who is willing and able to work is able to find work, is generally defined as an unemployment rate up to approximately 4%.

Inflation Rate

In March 2025, the inflation rate stood at 2.8%, which is up by 0.1% over last quarter and down by 6.5% since the high in June 2022. These rates continue the trend of slowing inflation, which may have a tempering effect on compensation increases. Inflation can influence the growth of compensation, and the extent of that influence also varies depending on the level of inflation, with high inflation related to higher levels of compensation growth.

In summary, the labor market remained largely unchanged over the first quarter of 2025 with minimal shifts in job openings, hires, quits, and unemployment rates. This consistency in the labor market, constraints on organization budgets, and low current inflation point towards an environment with less pressure on compensation growth than we have seen in the past several years. However, if tariffs lead to higher inflation, then we may see increased compensation growth towards the end of 2025. ERI expects moderate compensation growth continuing through 2025, with the potential of higher growth towards the end of 2025, depending on economic conditions. ERI will continue monitoring and reporting on these trends as they unfold over the next several quarters.

For a deeper analysis into these labor market and economic indicators and their impacts on compensation growth, please see ERI’s April 2025 National Compensation Forecast.

Overall Salary Trends

April salary growth (0.63%) is up slightly from the January 1 data release (0.60%), which is lower than the predicted quarterly rate of 0.69%. Growth over the past year has been 2.66%, with an average quarterly growth of 0.66%. To put this into context, the average quarterly growth over the past 20 years has been 0.71%. Over the same 20-year period, the average April increase has been 0.64%. Over the past 20 years, April increases (first quarter) have been lower than increases throughout the rest of the year, and the current quarter is no exception. The annual growth rate appears to have decreased from 2.82% to 2.62%, with growth rates in previous quarters of 0.6% (January 2025), 0.6% (October 2024), and 0.84% (July 2024).

Overall Trends by Year

ERI’s April 2025 National Compensation Forecast also takes a closer look at overall trends by year by examining budget increases, structure increases, and expected increases over a ten-year period. This illustrates where the reality of salary movement has departed from the expected trend, giving us information regarding how salaries might move in the future. Compensation growth in 2025 appears to be slowing since the ten-year peak in 2022.

Salary Growth by Category

The April 2025 National Compensation Forecast also analyzes mean annual, three-year, and ten-year total salary growth trends by occupational category to understand how different types of occupations move relative to each other and across time. Not all occupations grow at the same rate, and not all occupations grow at the same rate across time. As of April 2025, Sales employees saw the highest level of growth, whereas Top Management occupations saw the slowest growth over the ten-year period spanning 2015 to 2025.

To learn more, please download the full April 2025 National Compensation Forecast and watch for upcoming quarterly reports on compensation growth trends at www.erieri.com.

ERI Economic Research Institute was founded over 30 years ago to provide accurate and up-to-date salary survey data and compensation management applications for private and public organizations. Our talented team of professionals is among the best in the industry. Most of the Fortune 500 and thousands of small and medium organizations rely on ERI data and analytics for key compensation decisions. We provide high quality, in-depth compensation data for over 39,000 positions in more than 1,000 industries and over 10,000 locations around the globe to support our subscribers in making reliable pay decisions. An added benefit is the wealth of resources available to ERI customers.

ERI’s Assessor Series® – Solutions for every compensation decision

Remote Work Trends & Practices in 2024

During the COVID-19 pandemic, many organizations turned to remote work as a necessity to remain operational and productive while ensuring the safety of their workforces. Now, almost five years since the outbreak of the pandemic, myriad organizations are shifting towards a return to the workplace, encouraging or even requiring some employees to work in the office for part or all of the work week. Organizations often value the collaboration that face-to-face communication facilitates, along with the ability to train and oversee employees in person. On the other hand, many employees have grown accustomed to remote work and value not only the flexibility it provides but also the time and costs saved in avoiding the office commute. Considering these benefits, many employees are factoring the option of remote work into their decisions to take a new position or remain employed with an organization.

Given these remote work trends, organizations must make careful decisions about whether to offer remote work, provide a hybrid remote work option in which employees can work remotely part of the week and work in the office the remainder of the week, or mandate a full return to the office. In order to attract, retain, and motivate employees, organizations must stay abreast of current industry trends regarding remote work, knowing that new and current employees now place a significant value on the remote work option. Striking the right balance will be key to any organization’s success.

To that end, this blog post will highlight some findings related to remote work practices and trends from a recent survey conducted by ERI and summarized in the white paper, “Merit Increases, the Changing Economy, and Remote Work – Fall 2024.”  Between October 7 and November 11, 2024, ERI conducted a survey of organizational responses concerning merit increases, compensation and workforce planning, and remote work. There were 327 organizations that submitted answers to the survey during that time. The goal of this survey was to identify the changes that organizations are making to their labor and compensation practices, particularly merit increases, as a direct result of the rise in remote workforces and economic gauges, such as inflation. ERI’s recent white paper, “Merit Increases, the Changing Economy, and Remote Work – Fall 2024,” offers insights into the present impact of these compensation drivers. To summarize the results of the study, this paper is split into the following sections: Merit Increase Policies and Planning, Compensation and Workforce Planning Changes, Remote Work Changes, and Organization Scope.

Looking specifically at the Remote Work Changes section of ERI’s latest white paper, several interesting trends were uncovered in this survey. First, ERI found that remote work is persisting, but there is a reduction in remote work hiring. ERI asked, “Are you currently hiring remote workers?” to determine if organizations were changing their approach to hiring remote workers. Many organizations, specifically 25% of respondents, are hiring remote workers without any specific restrictions. Additionally, 20% of organizations are not hiring remote workers at all but are hiring on-site employees. In a similar vein, 5% of organizations are reducing or eliminating the hiring of remote workers. Notably, 8% of respondents also indicated that they do not have an established policy on remote worker location, while the remaining 4% confirmed that they do not have remote workers and therefore do not have an established policy.

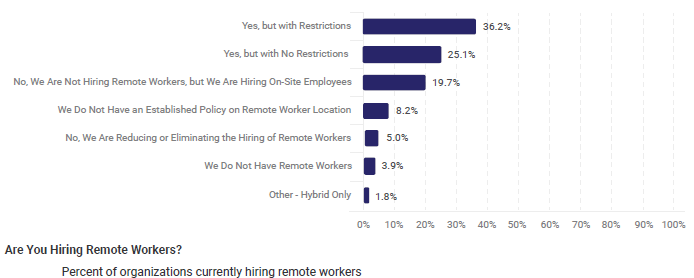
However, 36% of respondents reported that, while they are hiring remote workers, it is only under certain circumstances. Generally, these organizations noted the following restrictions: the position must be capable of being done remotely, the employee must be hybrid, or some restriction that is otherwise contingent on business needs.

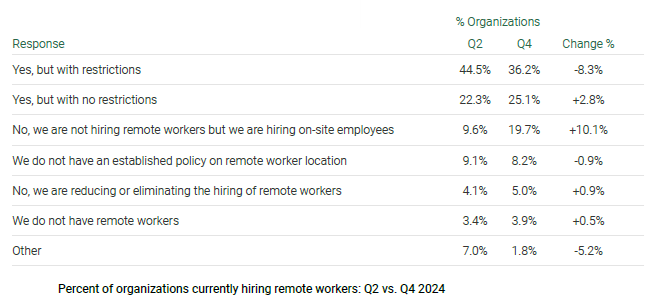
Comparing Q2 to Q4 2024, there has been a notable 10% increase in participant organizations reporting that they are not hiring remote workers but are hiring on-site employees. Similarly, there has been an 8% decrease in the number of participant organizations reporting that they are hiring with restrictions, while reports of restriction-free hiring have only increased by 3%. These remote work trends may be indicative of the increasingly commonplace return-to-work initiative that many organizations have been undertaking since the decline of the COVID-19 pandemic.

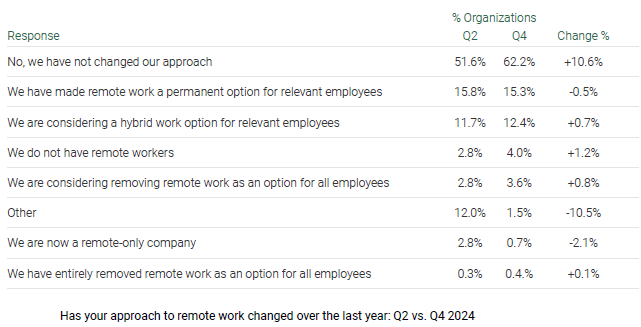
ERI asked survey respondents to note if they have changed their approach to remote work over the last year. The results concluded that many organizations have chosen to adopt some form of continued remote work, although the number of organizations reporting that they changed their policy have declined considerably since 2022. See ERI’s “Remote Work, AI, and Compensation Best Practices – Spring 2024” white paper for additional details.

As of Q4 2024, remote work has become a permanent option at 15% of organizations, and 12% indicated that they have adopted a hybrid work-from-home option for employees to work remotely on a part-time basis. The nature of some jobs disallows them from being able to work from home, and 4% of respondents confirmed that they have no remote workers for whom they can make remote work changes. Furthermore, 0.4% of organizations reported that they have removed their work-from-home option, and 4% are currently considering removing it. Moving from Q2 to Q4 2024, the most notable change is the 11% increase in participant organizations that reported that they have not changed their approach.

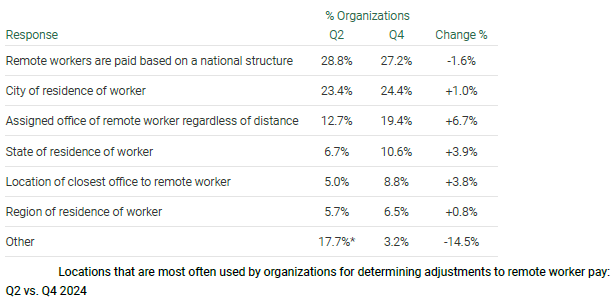
The survey yielded interesting results regarding the geographic basis for adjustments to remote worker pay. Currently, most organizations account for geography in some fashion when setting pay for remote workers. To clarify how organizations plan to adjust compensation, the survey asked, “Which location are you using to determine any adjustments to remote worker pay?” Of all participant organizations, 73% are using a specific location, while the remaining 27% are using a national structure rather than a specific location to decide adjustments for remote worker pay. Of those using a specific location, most are using the worker’s city of residence to decide adjustments for remote worker pay (24%), followed by the assigned office of the remote worker, regardless of distance (19%).

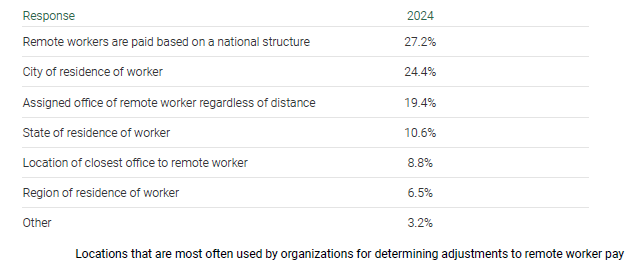
Moving from Q2 to Q4, there has been a 1% increase in organizations that are using the city of residence of the employee, a 4% increase in using the state of residence, and, most drastically, a 7% jump in using the assigned office of the remote worker, regardless of distance.

In summary, remote work persists as an option for most organizations, though the survey suggests a reduction in remote work hiring. There appears to be a trend towards streamlining and standardizing compensation policies for remote work compared to ERI’s previous survey, “Remote Work, AI, and Compensation Best Practices – Spring 2024.” Organizations are less concerned with remote-specific factors, such as employee-specific area adjustments. This coincides with the wider ongoing movement away from remote work in a post-COVID-19 world and towards a return to the office. In observing remote worker hiring practices, there has been a noteworthy 10% increase from Q2 to Q4 2024 in actively preferring on-site to remote workers. That said, remote work certainly remains an option in many organizations, and the compensation community is starting to  coalesce around standard practices that integrate remote work.

This survey is part of a series of surveys aimed at examining and measuring changes to compensation and the labor force following the COVID-19 pandemic. It is the third of these surveys to be published post-pandemic that specifically addressed changes in the workforce in relation to remote work and economic drivers, such as inflation. The next survey will take a deep dive into remote work and performance management, examining which performance management practices organizations are using, particularly in relation to remote worker performance. For those interested in participating in the upcoming survey, “Workforce Insight Survey: Remote Work, Performance, and Compensation Best Practices in the Changing Economy,” please visit https://resources.erieri.com/free-workforce-insight-survey. The results of this survey will be free with participation.

For more information on how COVID-19 and post-pandemic economic factors have affected compensation, visit www.erieri.com. ERI compiles salary survey data on a semi-quarterly basis to help organizations understand and accurately benchmark compensation rates. Information published on our websites captures salary changes throughout the year and helps HR professionals plan and develop business strategies.

Top 20 Highest-Paid CEOs in Technology

Leaders of the technology industry have a discerning eye for inventiveness and are often admired for piloting the industry towards innovation and ingenuity. Technology leaders are known for their insightful vision, planting the seeds for advancements to take root and thrive in a highly competitive industry. In an ever-evolving industry like technology, HR professionals must rely on current market data to accurately benchmark salaries that attract and retain top talent.

Even in the face of constant transformation, effective tech executives can steer companies towards success. This is what makes them so invaluable and some of the highest-paid executives of any industry—their clever intuition for enterprise is one of the very factors that influence their compensation packages, which are already quite complex.

To understand executive compensation packages for tech CEOs, we must first explore which factors contribute to executive pay and the reasoning behind them. This helps HR and compensation analysts make the most accurate decisions in salary planning.

Technology CEO Total Compensation Factors

CEO compensation in the technology industry is dependent on multiple factors. Beyond their base salary, a tech industry CEO’s total rewards package is typically largely comprised of additional pay components, such as stock awards, additional benefits, and performance-based incentives. Executive compensation is often tied to company performance because of the competitive and fast-paced nature of the technology industry. More than anything, technology is an industry that hinges on risks and investments, which makes clear executive leadership crucial for final decision-making processes.

Highest-Paid Technology CEOs

The technology sector continues to dominate executive compensation, with its top CEOs earning multimillion dollar salaries supplemented by stock awards, bonuses, and other incentives. As tech companies expand their global influence, executive pay packages reflect the intense competition for leadership talent capable of driving shareholder value and encouraging product innovation. The chart below highlights the highest-paid CEOS in the technology industry based on data collected in 2024, in order of highest total compensation, highlighting how base salary factors into the total.

NameCompanySalaryTotal
Satya NadellaMicrosoft Corp$ 2,500,000.00$ 79,106,183.00
Timothy CookApple Inc$ 3,000,000.00$ 74,609,802.00
Matthew MurphyMarvell Technology Group Ltd$ 1,138,698.00$ 45,163,040.00
Marc BenioffSalesforce.com Inc$ 1,550,000.00$ 39,642,173.00
Shantanu NarayenAdobe Inc$ 1,500,000.00$ 52,390,182.00
Charles RobbinsCisco Systems Inc$ 1,390,000.00$ 39,202,654.00
Sasan GoodarziIntuit Inc$ 1,200,000.00$ 36,572,360.00
Timothy ArcherLam Research Corp$ 1,176,923.00$ 30,135,041.00
Sanjay MehrotraMicron Technology Inc$ 1,416,909.00$ 30,060,126.00
Vincent MatteraII-VI Inc$ 1,060,096.00$ 28,811,152.00
Julie SweetAccenture PLC$ 1,550,000.00$ 24,915,146.00
Richard WallaceKLA Corp$ 1,129,905.00$ 22,832,965.00
Vincent RocheAnalog Devices Inc$ 1,137,692.00$ 22,436,615.00
Thierry DelaporteWipro Ltd$ 3,900,827.00$ 20,111,105.00
Michael SalvinoDXC Technology Co$ 1,350,000.00$ 19,821,384.00
David GoeckelerWestern Digital Corp$ 1,245,192.00$ 17,690,772.00
George SchindlerCGI Inc$ 1,921,418.00$ 14,162,558.00
Serge GodinCGI Inc$ 1,301,000.00$ 13,710,280.00
Nazzic KeeneScience Applications International Corp$ 1,258,224.00$ 12,895,917.00
Philip GallagherAvnet Inc$ 1,200,000.00$ 8,775,978.00

This table presents the top 20 highestpaid CEOs based on total reported compensation. While stock awards and performancebased variable compensation form a significant portion of executive pay, base salaries are a fraction of total earnings.

Be mindful that compensation figures may change over time, reflecting market dynamics, company performance, and industry trends. Stay informed of the latest compensation survey data to ensure your salary plan remains up to date and competitive within your industry.

For a more detailed breakdown of executive compensation in technology or other industries, turn to ERI’s Executive Compensation Assessor, which provides a complete analysis of compensation factors at the executive level, including salaries, bonuses, long-term incentives, non-equity incentives, stock awards, option awards, pension, other compensation, and more. ERI’s Assessor Platform is designed to help you customize your executive compensation analysis to confidently grasp how executive salaries compare in your specific industry and make the most accurate data-driven decisions.

Enjoyed this article? Learn more about top executive compensation in various industries at ERI, including the top 20 highest-paid CEOs in health care.

Top 20 Highest-Paid CEOs in Health Care

The health care sector is comprised of multiple sub-industries and diverse professions that work in tandem to provide for and service health needs and concerns. As the health care sector develops and tackles emerging and challenging issues – such as talent shortages, shift differential analysis, and regulatory compliance complexities – it is important for HR professionals to accurately benchmark salaries, particularly at the top executive level, based on current market data and industry trends.  

Despite growing challenges, ERI’s 2025 Salary Increase Survey projects the budget for executive compensation in health care to increase by 3.9 % this year, indicating that salaries for CEOs in health care should remain steady. CEO pay in health care is a complex topic, and the best way to approach it is by first understanding the myriad factors that contribute to executive compensation in this unique industry.  

CEO Compensation in Health Care 

The increase in CEO compensation reflects the complexity of managing and navigating care in an increasingly unpredictable climate, particularly given the impacts of the COVID-19 pandemic, high inflation, government policies, etc. This makes the demand for talented executive leaders critical, as their duties span not only quality and managed care, but also legal services and compliance.  

In general, total compensation packages are dependent on a range of factors, such as the specific sub-industry, geographic location, organization size, and competitiveness. Moreover, salaries are significantly influenced by individual factors, including a professional’s level of education, specialization, experience, and relevant skills and certifications. However, at the executive level, geographic location may not necessarily be a crucial factor in benchmarking executive salaries because these roles are often recruited at the national level from candidates with experience in the industry. In the end, multiple elements determine an executive’s overall compensation package.  

Top 20 Highest-Paid CEOs in Health Care 

Below is a list of the top 20 CEOs in health care based on the most recent complete form year (2024). For this list, base salary serves as the rank-order metric as it is predetermined and the most fixed among the various forms of executive compensation.

First NameLast NameTitleCompanySalaryTotal Compensation
WilliamSiboldDirector, President and Chief Executive OfficerMadrigal Pharmaceuticals Inc$275,400.00$32,268,400.00
AriBousbibChairman of the Board and Chief Executive OfficerIQVIA Holdings Inc$1,800,000.00$29,151,752.00
JosephHoganPresident, Chief Executive Officer and DirectorAlign Technology Inc$1,354,769.00$28,952,411.00
JoaquinDuatoChairman of the Board and Chief Executive OfficerJohnson & Johnson$1,584,615.00$28,397,240.00
DavidRicksChairman of the Board, President and Chief Executive OfficerEli Lilly and Co$1,621,154.00$26,565,732.00
JasonHollarChief Executive Officer and DirectorCardinal Health Inc$1,434,153.00$25,650,709.00
RamiElghandourPresident, Chief Executive Officer and Chairman of the BoardArcellx Inc$600,960.00$24,964,306.00
AlbertBourlaChairman of the Board and Chief Executive OfficerPfizer Inc$1,800,000.00$24,648,727.00
SamuelHazenDirector and Chief Executive OfficerHCA Healthcare Inc$1,539,947.00$23,799,137.00
AndrewWittyDirector and Chief Executive OfficerUnitedHealth Group Inc$1,500,000.00$23,534,936.00
RobertFordChairman of the Board and Chief Executive OfficerAbbott Laboratories$1,500,000.00$23,268,171.00
DavidCordaniChairman of the Board, President and Chief Executive OfficerThe Cigna Group$1,573,077.00$23,251,096.00
RobertBradwayChairman of the Board, President and Chief Executive OfficerAmgen Inc$1,786,977.00$22,643,650.00
DanielO'DayChairman of the Board and Chief Executive OfficerGilead Sciences Inc$1,740,962.00$22,607,690.00
GailBoudreauxPresident, Chief Executive Officer and DirectorAnthem Inc$1,600,000.00$21,889,039.00
KarenLynchDirector, President and Chief Executive OfficerCVS Health Corp$1,500,000.00$21,615,034.00
MichaelMahoneyChairman of the Board, President and Chief Executive OfficerBoston Scientific Corp$1,400,000.00$21,420,801.00
RainerBlairDirector, President and Chief Executive OfficerDanaher Corp$1,300,000.00$20,903,282.00
KevinLoboChairman of the Board, Chief Executive Officer and PresidentStryker Corp$1,391,667.00$20,767,847.00
ReshmaKewalramaniDirector, President and Chief Executive OfficerVertex Pharmaceuticals Inc$1,500,000.00$20,594,441.00

Be mindful that compensation figures may change over time, reflecting market dynamics, company performance, and industry trends. Stay informed of the latest compensation survey data to ensure your salary plan remains up to date and competitive within your industry.  

For a more detailed breakdown of executive compensation in health care or other industries, turn to ERI’s Executive Compensation Assessor, which provides a complete analysis of compensation factors at the executive level, including salaries, bonuses, long-term incentives, non-equity incentives, stock awards, option awards, pension, other compensation, and more. Those interested specifically in nonprofit executive compensation should consider ERI’s Nonprofit Comparables Assessor, which allows you to generate benchmark reports based on salary data from comparable peers in tax-exempt and/or for-profit organizations. ERI’s Assessor Platform is designed to help you customize your executive compensation analysis to confidently grasp how executive salaries compare in your specific industry and make the most accurate data-driven decisions. 

Enjoyed this article? Learn more about top 10 executive compensation in various industries at ERI, including the top 10 highest-paid CEOs at nonprofits 2024 and the top top 10 highest-paid CEOs in the construction industry.   

ERI in the News — Executive Compensation

Check out Trade Show Executive’s recent article “What’s in Your Wallet?,” by Danica Tormohlen, Contributing Editor. Tormohlen contacted ERI for compensation research and insight while compiling a special report on compensation trends for trade show executives.

Visit ERI’s News Room for more press mentions, recent press releases, and quarterly newsletters, as well as contact information for media inquiries.

When was the Last Time You Adjusted Your Salary Structures for Compensation Planning?

Get ready for 2011 merit increases and compensation planning. Historically, at this time of the year, most compensation professionals on a fiscal calendar planning cycle begin “kicking off” their communications and planning calendars. Many anticipate this year to have the highest merit increases since the 2007 financial crisis, after “tightening the belts” the past few years.

Two things will be required to have an effective compensation planning cycle for 2011: Job Evaluations and Salary Structure Adjustments. Since workers are doing more with less, their jobs have likely changed, creating new hybrid jobs. Job evaluations to re-validate core benchmark jobs serve as a foundation for determining the salary structure adjustments. Unfortunately, there are no shortcuts here. Let’s take, for example, a retail organization in West Lafayette, Indiana, named Jenny Jeans. Two benchmark jobs, Warehouse Worker and Merchandise Marker, are representative of 15% of the company’s workforce and are in the same salary grade. The Compensation Analyst conducts a job analysis doing an on-site visit and concludes these two jobs have melded together to become a hybrid job subsequent to job losses experienced at the organization and is now titled Warehouse Merchandise Specialist. The new hybrid job responsibilities are weighted 40% Merchandise Marker and 60% Warehouse Worker.

Now, we want to market-price the core benchmark jobs (Cashier, Packer, and Warehouse Merchandise Specialist) in this salary grade and determine the adjustment to this grade within Jenny Jeans’ overall salary structure. To do this you will need to have access to recent salary survey data. Once you have the external data, market-price the benchmark jobs, calculate the differential between the market data and the actual internal pay rates and determine the adjustment to the midpoint or control point of the salary grade that is aligned with overall business objective and strategy. (Note, the market data has been adjusted to the January 2, 2012, effective planning date for the merit increases.) The minimum and maximum of the grade should be adjusted keeping the current spread (unless you are considering redesigning the overall structure, which is beyond the scope of this blog).

This process will need to be repeated for each salary grade in your salary structure. If you have any questions about the tools used in these explanations, please contact ERI at 800.627.3697.

New ERI White Paper

ERI Economic Research Institute’s recent white paper, “Five Technical Aspects of Compensation Data” by Jonas Johnson, Senior Researcher, is available for download via www.erieri.com.

In this white paper, Johnson explores the curvilinear nature of data, outliers, wage fluctuation, accurately aging data, and heteroscedasticity.

“Compensation professionals should consider these factors prior to setting pay practices,” writes Johnson. “Ignoring them could result in less than optimal data analyses, potentially resulting in a loss of talent or overpayment for labor.”

Technically Speaking… Does Excel Always Know What is Best For Your Compensation Data?

The use of Microsoft Excel in the business compensation environment for performing quick and easy calculations has become ubiquitous, making the need to cite usage statistics pretty much meaningless. I often cut and paste data into a spreadsheet for some quick compensation data analyses, even when I have much more powerful statistical software packages at my disposal.

It was during one of these exercises that something odd in my Excel spreadsheet jumped out at me. I was reviewing a long list of salaries for Non-Profit Executive Directors, focusing on the 10th percentile, and the values reported by Excel were, in my opinion, well, illogical.

So, I tried an experiment comparing the results from Excel 2007 to my “powerful” statistics software (SAS 9.2). I then discovered the SAS software has five different algorithms for calculating percentiles, while Excel presents a single result.

Rather than start with a long list of salaries, I started small. I went to the Internet and grabbed the first 35 numbers in the Fibonacci Sequence. I ranked them in order and just took a guess at what the 10th percentile might be.

With 35 numbers, N/10 = 3.5, and I came up with two guesses at the 10th percentile; either the 4th number in the sequence (which is 2) or, if interpolated, halfway between the 3rd and 4th numbers (which is 1.5). I decided my best answer would be 2.

Let’s take a look at the actual results.

All five SAS results fall in line with my original guesses (between 1.5 and 2). However, Excel reports the percentile falling nearly halfway between the 4th and 5th numbers – the difference is up to 60% in this example!

What is going on? Well, Wikipedia[1] notes that Excel uses an “alternate” method to calculate percentiles. While these numbers are small, just a 0.9 difference, think about it in terms of salary planning. Multiply these numbers by $10,000, and now that 10th percentile is off by an amazing $9,000!

Conclusions? Well, first, I will be very cautious using Excel to calculate percentiles. The fact that this discrepancy was obvious in a list of actual salaries does lead me to recommend when analyzing important data using Excel, take the time to ensure the results make sense. Attributing a $9,000 discrepancy to Excel’s quirky percentile algorithm may not get you very far.

Of broader concern is that Excel doesn’t provide any information in Help, or elsewhere, letting me know what choices it is making for me in regard to my data. I had assumed that it just knew what was best and, by not giving me any choices or even documenting the option it uses, I had no reason to question its authority. Now I do.

1 Wikipedia – Percentile. Retrieved 6 June, 2011 from http://en.wikipedia.org/wiki/Percentile