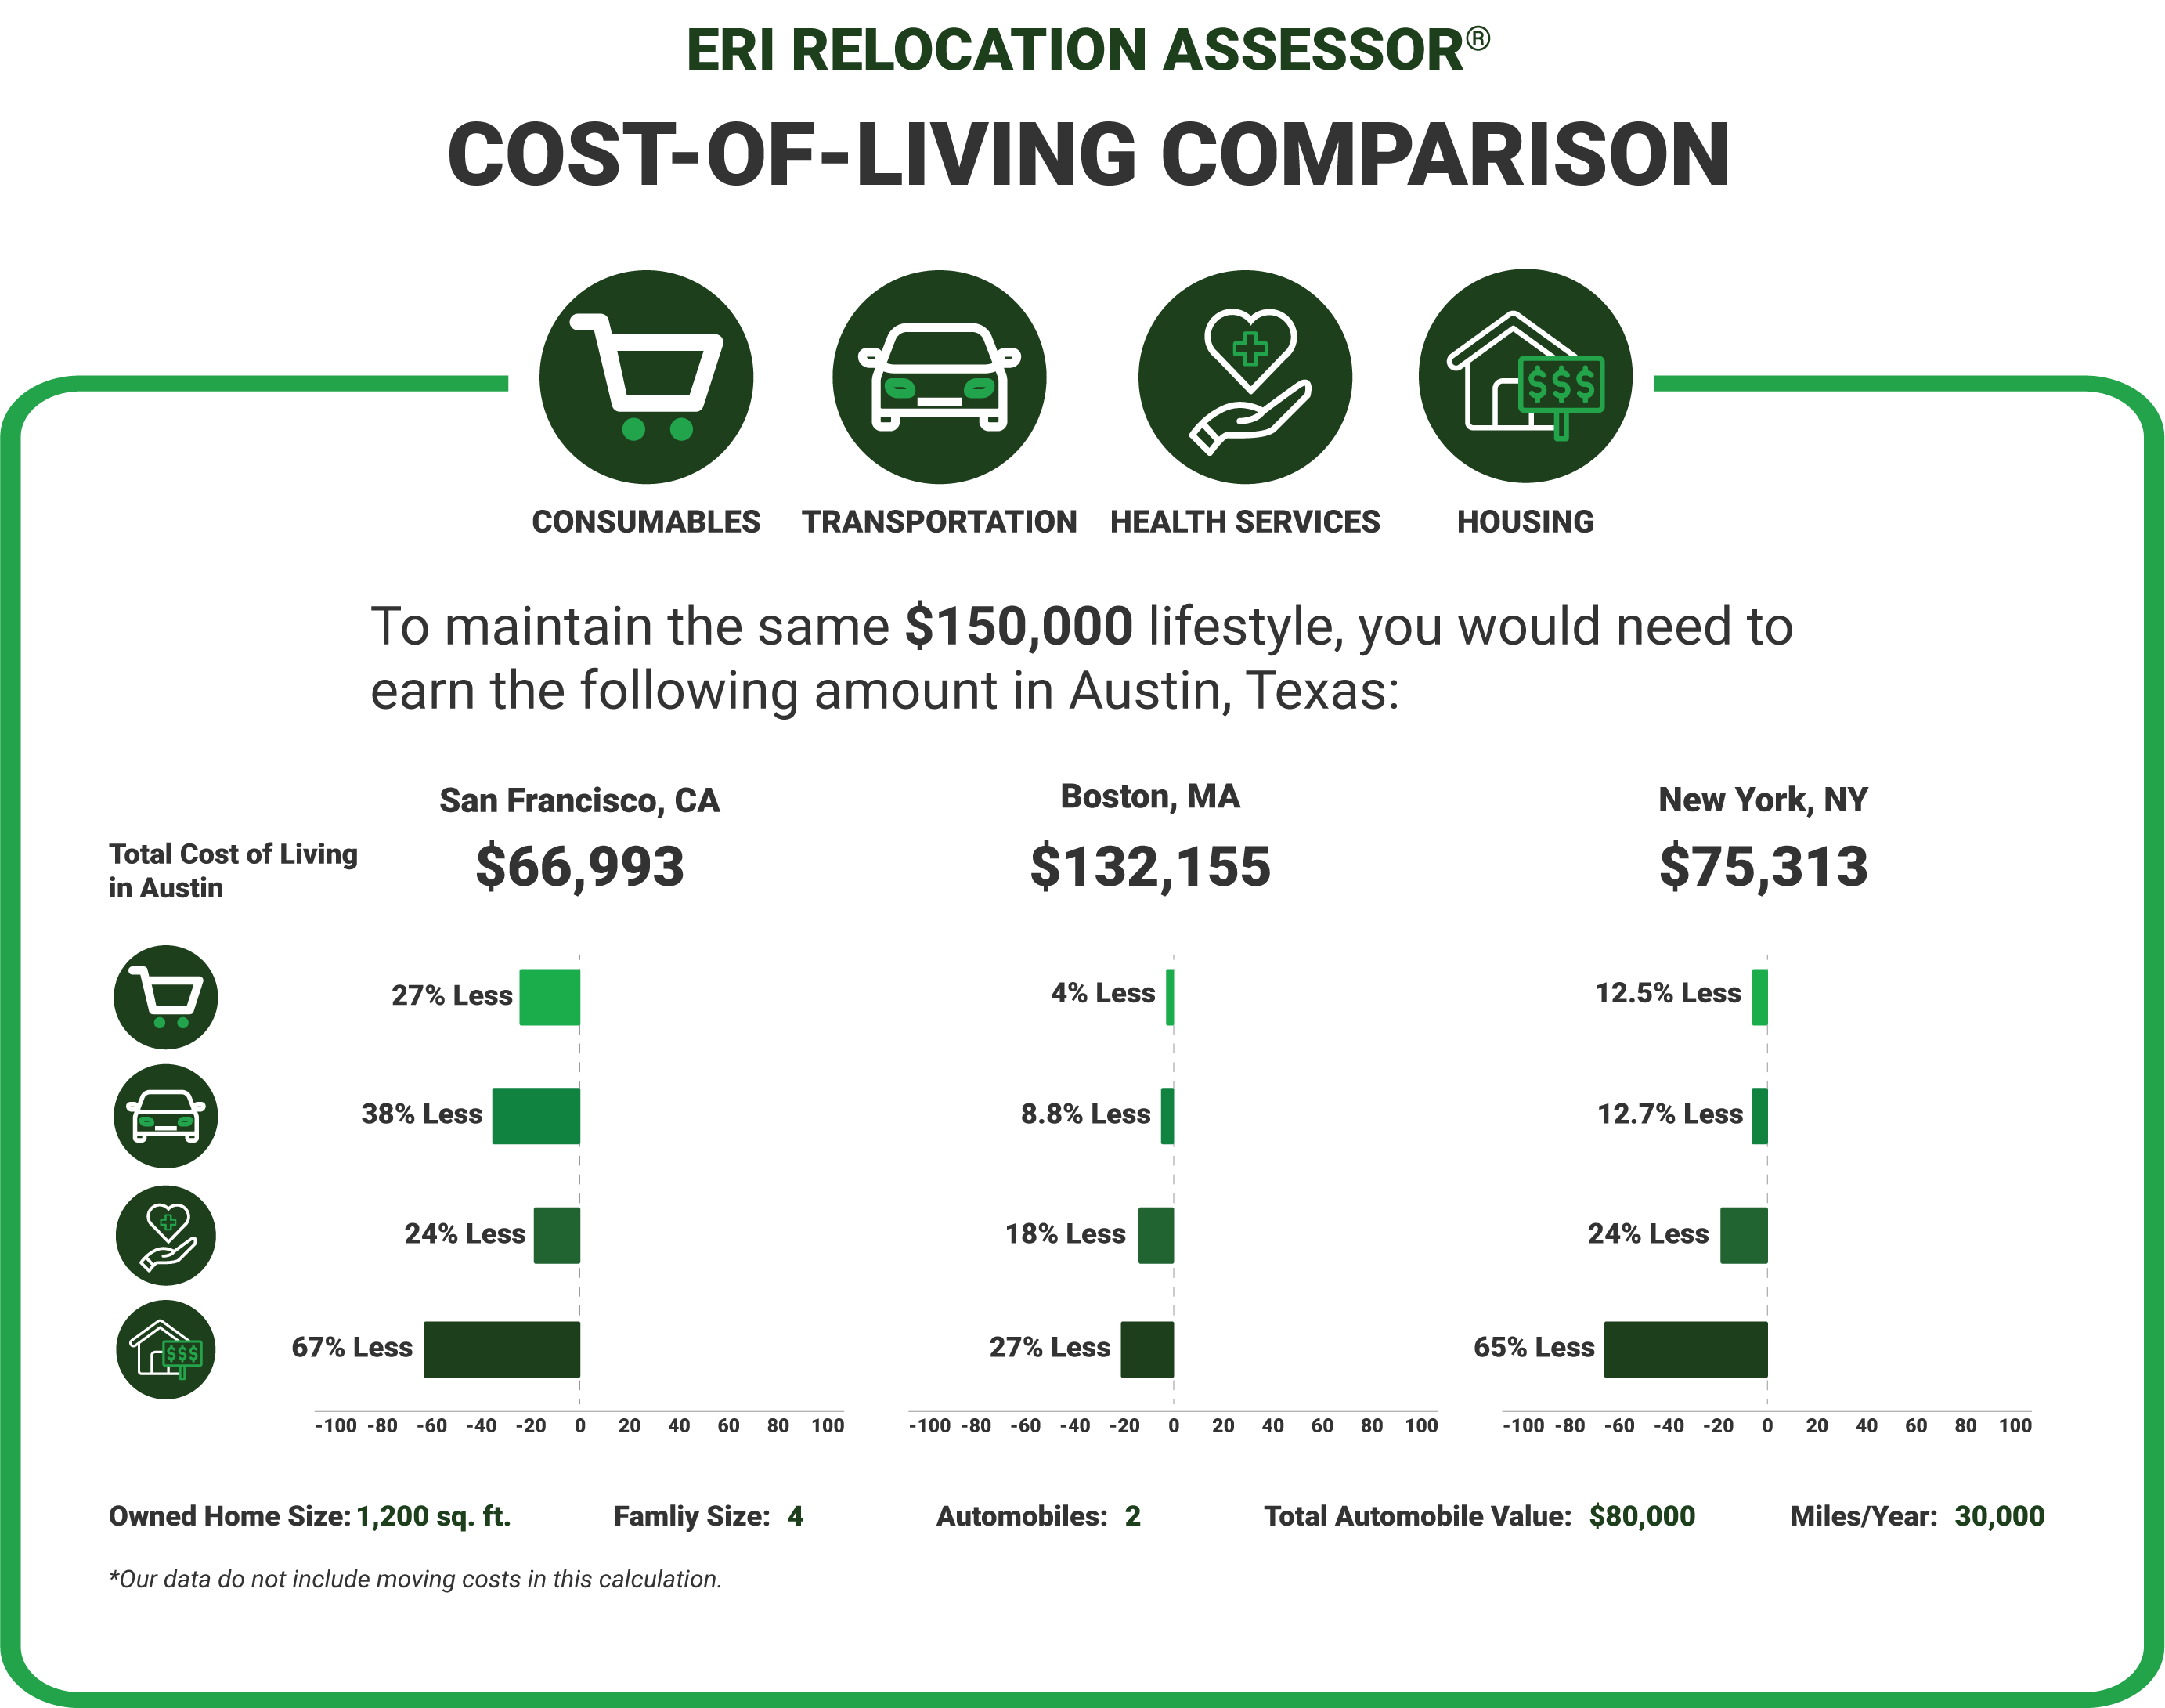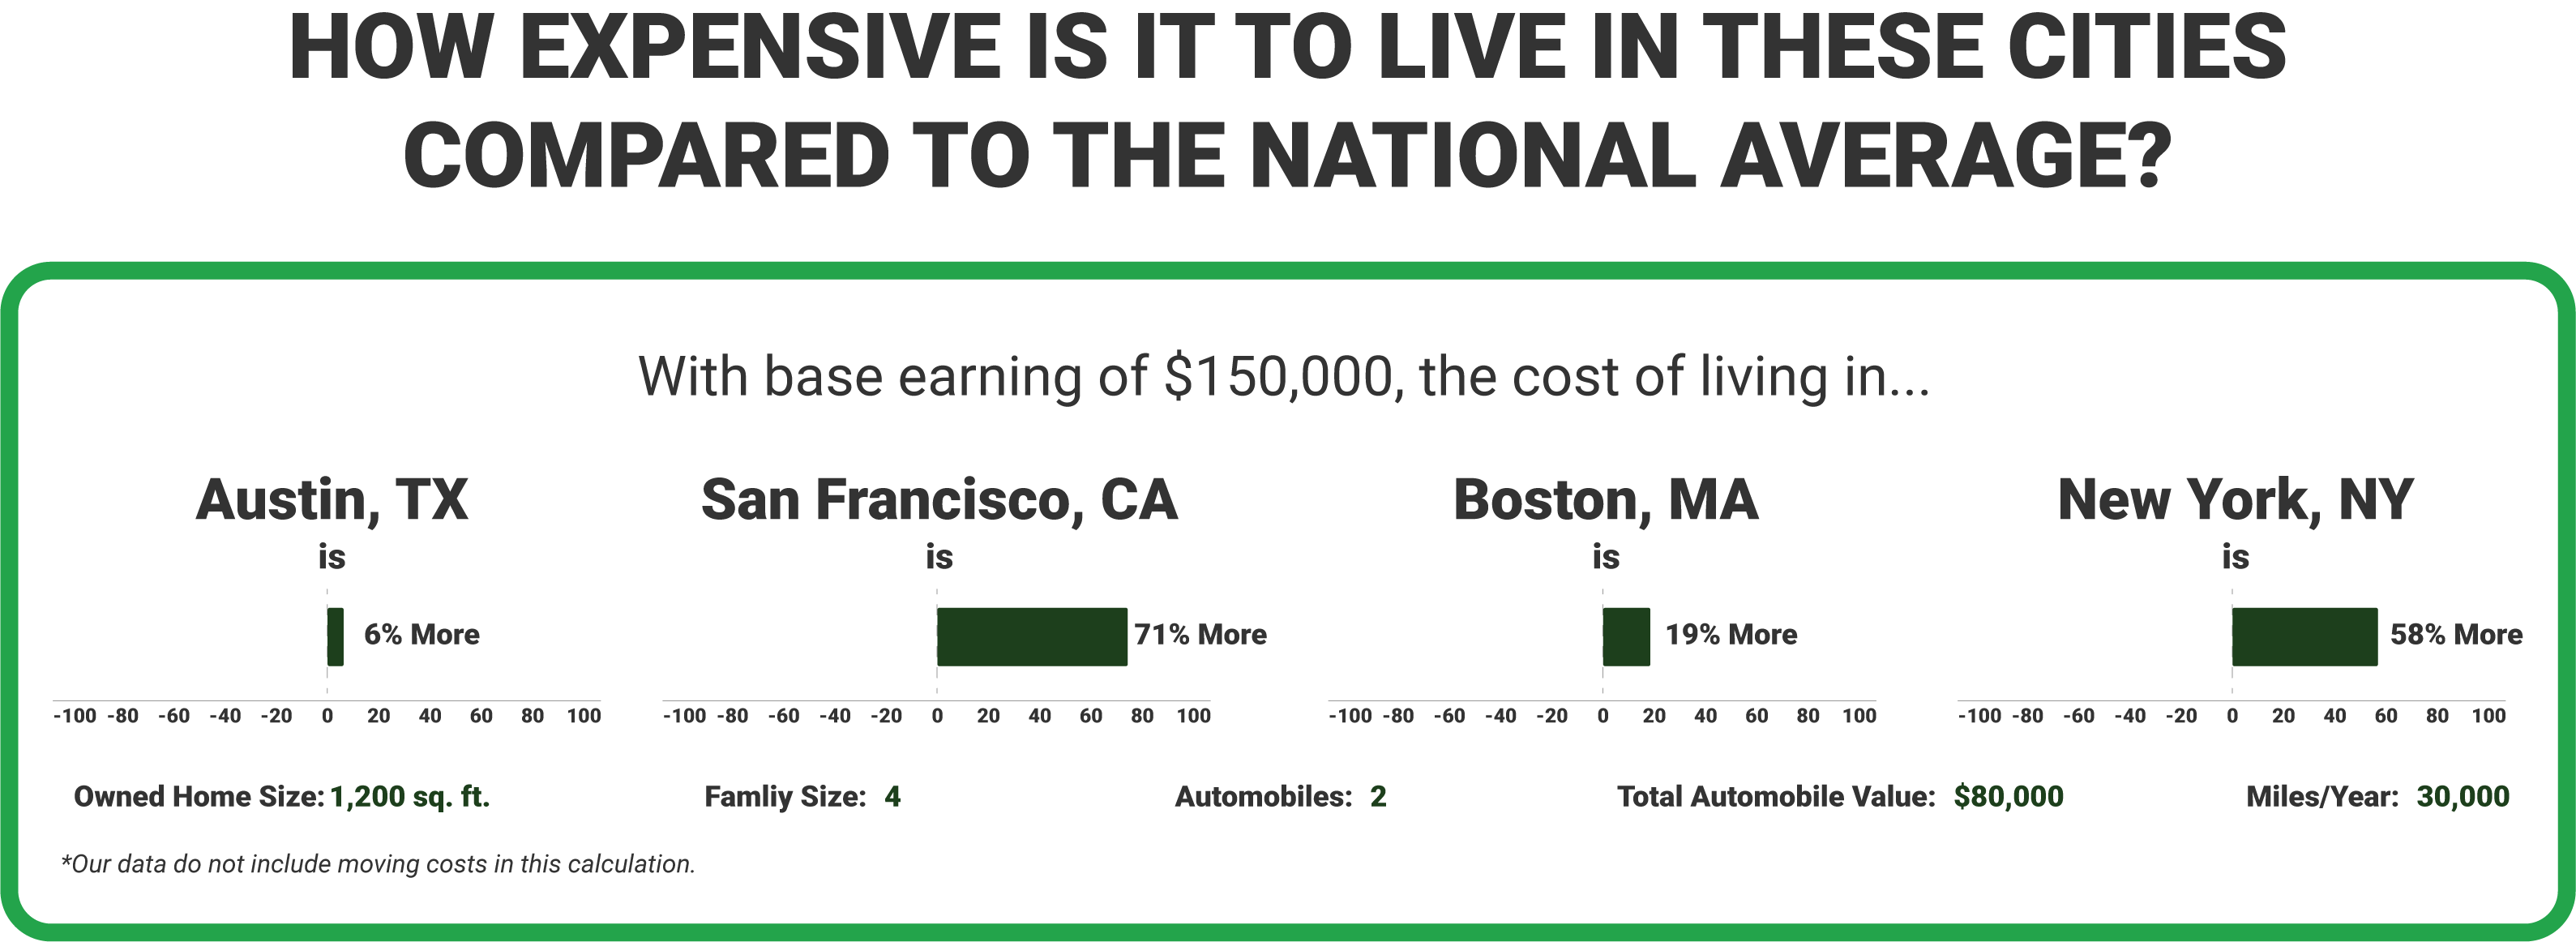
ERI Economic Research Institute’s Cost-of-Living Index ranks the cost of living for heavily populated U.S. cities using the total cost of essential market basket items for each city indexed against the U.S. average. Rankings are determined by the prices of essential goods and services, including housing, consumables, transportation, health services, and tax obligations, by location.
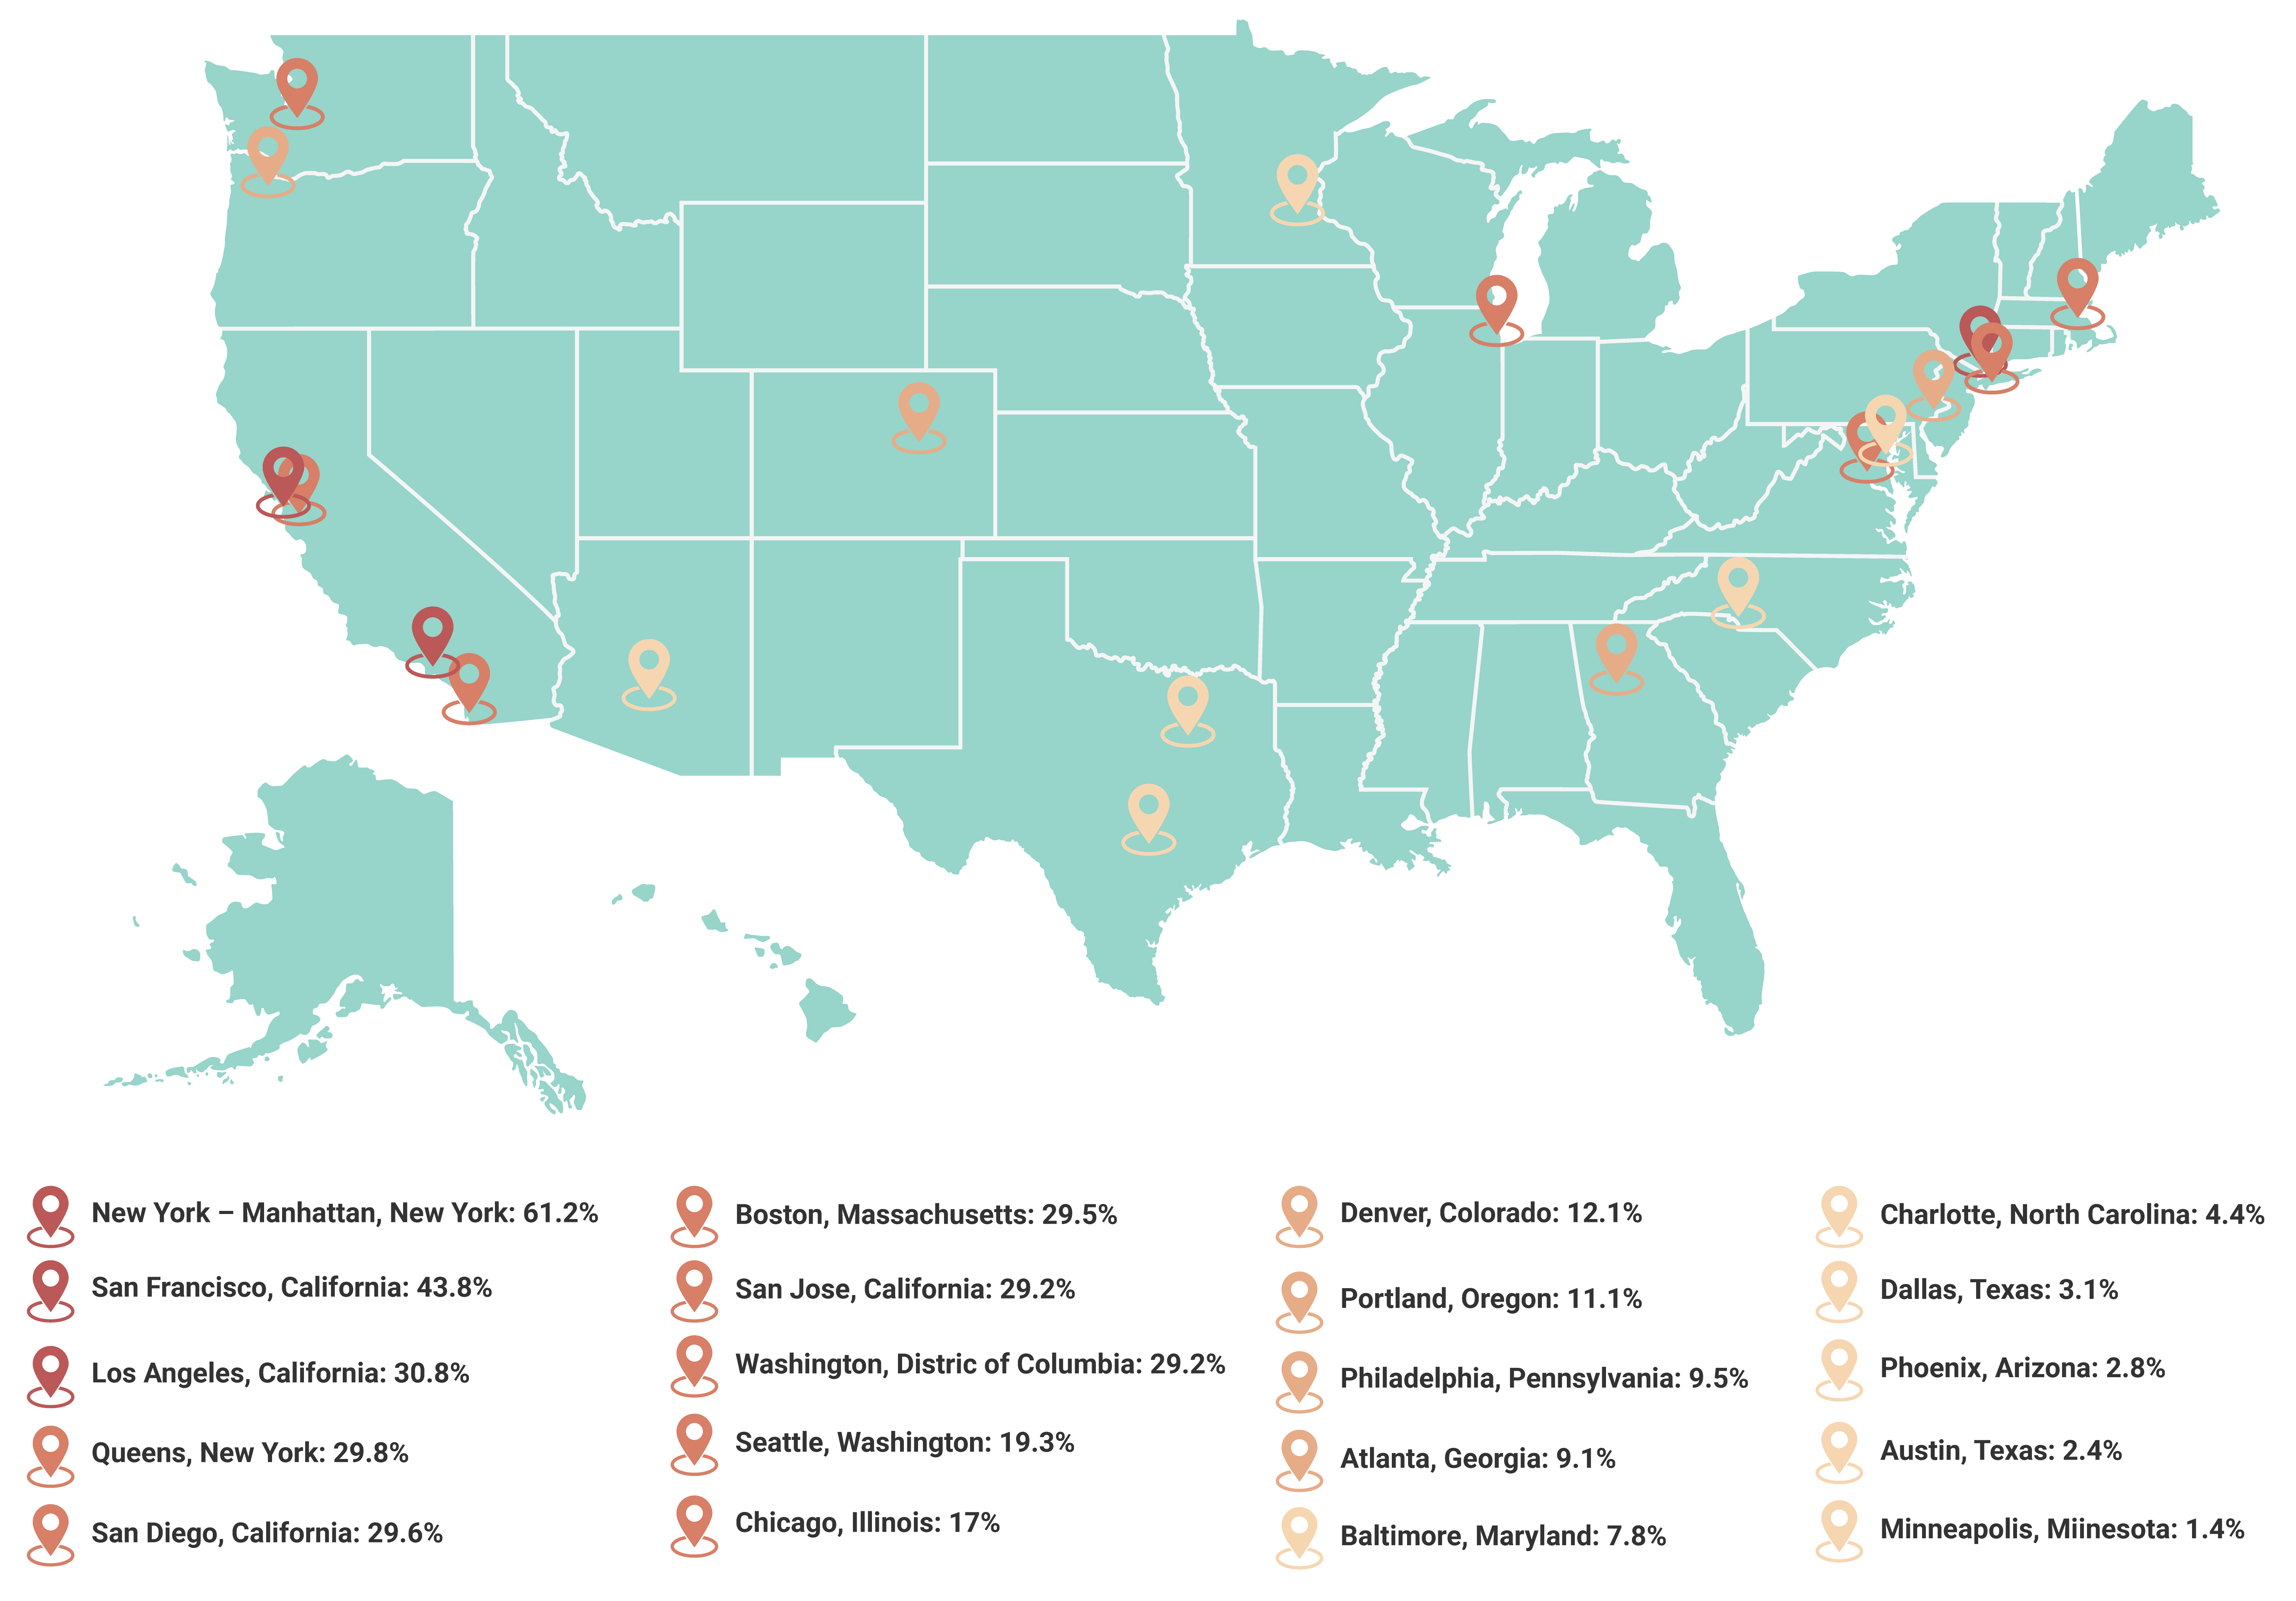
The list below is ordered from the highest to lowest cost of living for 20 major U.S. cities as of January 2025. The percentages were calculated using ERI’s Relocation Assessor and are based on the national average for a two-person household with a combined yearly income of $100,000 renting a 900 square foot apartment with one car.
- New York-Manhattan, New York
The cost of living in Manhattan, New York, is 61.2% higher than the national average. - San Francisco, California
The cost of living in San Francisco, California, is 43.8% higher than the national average. - Los Angeles, California
The cost of living in Los Angeles, California, is 30.8% higher than the national average. - Queens, New York
The cost of living in Queens, New York, is 29.8% higher than the national average. - San Diego, California
The cost of living in San Diego, California, is 29.6% higher than the national average. - Boston, Massachusetts
The cost of living in Boston, Massachusetts, is 29.5% higher than the national average. - San Jose, California
The cost of living in San Jose, California, is 29.2% higher than the national average. - Washington, District of Columbia
The cost of living in Washington, District of Columbia, is 24.2% higher than the national average. - Seattle, Washington
The cost of living in Seattle, Washington, is 19.3% higher than the national average. - Chicago, Illinois
The cost of living in Chicago, Illinois, is 17% higher than the national average. - Denver, Colorado
The cost of living in Denver, Colorado, is 12.1% higher than the national average. - Portland, Oregon
The cost of living in Portland, Oregon, is 11.1% higher than the national average. - Philadelphia, Pennsylvania
The cost of living in Philadelphia, Pennsylvania, is 9.5% higher than the national average. - Atlanta, Georgia
The cost of living in Atlanta, Georgia, is 9.1% higher than the national average. - Baltimore, Maryland
The cost of living in Baltimore, Maryland, is 7.8% higher than the national average. - Charlotte, North Carolina
The cost of living in Charlotte, North Carolina, is 4.4% higher than the national average. - Dallas, Texas
The cost of living in Dallas, Texas, is 3.1% higher than the national average. - Phoenix, Arizona
The cost of living in Phoenix, Arizona, is 2.8% higher than the national average. - Austin, Texas
The cost of living in Austin, Texas, is 2.4% higher than the national average. - Minneapolis, Minnesota
The cost of living in Minneapolis, Minnesota, is 1.4% higher than the national average.
Cost-of-living differentials are essential to compensation planning and are used to evaluate business or employee relocation, expansion, and remote work. Our Assessor Platform can help you stay on top of cost-of-living changes among cities and analyze cost-of-living differentials based on earnings level, home size, home ownership or rental, family size, number of autos, and automobile value.