How Minimum Wage Laws Impact Your Starting Salary

How Minimum Wage Laws Impact Your Starting Salary

If you have ever worked in a minimum wage position in different states or even in various cities, you would have noticed differences in the compensation amounts. In this article, we will explore the various aspects of state minimum wages in the United States and how your location and occupation affect your starting wage. 

State Minimum Wage Laws

While there is a federal minimum wage mandated by the Fair Labor Standards Act (FLSA), currently $7.25 per hour, individual states have the authority to set their minimum wage rates to suit their needs. Some states have not increased their state minimum wage for over a decade, whereas others have raised their rates regularly to better reflect the local cost of living. 

As of 2024, 20 states have not increased their wages for ten or more years: 

  1. Alabama 
  2. Georgia 
  3. Idaho 
  4. Indiana 
  5. Iowa 
  6. Kansas 
  7. Kentucky 
  8. Louisiana 
  9. Mississippi 
  10. New Hampshire 
  11. North Carolina 
  12. North Dakota 
  13. Oklahoma 
  14. Pennsylvania 
  15. South Carolina 
  16. Tennessee 
  17. Texas 
  18. Utah 
  19. Wisconsin 
  20. Wyoming 

On the other hand, 22 states increased their minimum wage rates at the start of the 2024 calendar year.1 Here are the new rates compared to the previous year: 

State 2024 Minimum Wage 2023 Minimum Wage

Alaska

$11.73

$10.85 

Arizona

$14.35

$13.85 

California

$16.00

$15.50 

Colorado

$14.42

$13.65 

Connecticut

$15.69

$15.00

Delaware

$13.25

$11.75

Hawaii

$14.00

$12.00

Illinois

$14.00

$13.00

Maine

$14.15

$13.80

Maryland

$15.00

$13.25

Michigan

$10.33

$10.10

Minnesota

$10.85

$10.59

Missouri

$12.30

$12.00

Montana

$10.30

$9.95

Nebraska

$12.00

$10.50

New Jersey

$15.13

$14.13

New York (NYC, Long Island, and Westchester)

$16.00

$15.00

New York (remainder of state)

$15.00

$14.20

Ohio

$10.45

$10.10

Rhode Island

$14.00

$13.00

South Dakota

$11.20

$10.8

Vermont

$13.67

$13.18

Washington

$16.28

$15.74

Regional and Industry Differences 

Even within states and counties, there can be variations in minimum wage rates due to specific regional disparities, such as cost of living, industry or occupation of the employee, or even city borders. 

Consider the city of Los Angeles, for example, where pocket areas are subject to their own laws since they are not considered part of the city.  For a visual example of the outliers, you can see the unhighlighted areas that are not considered part of L.A.


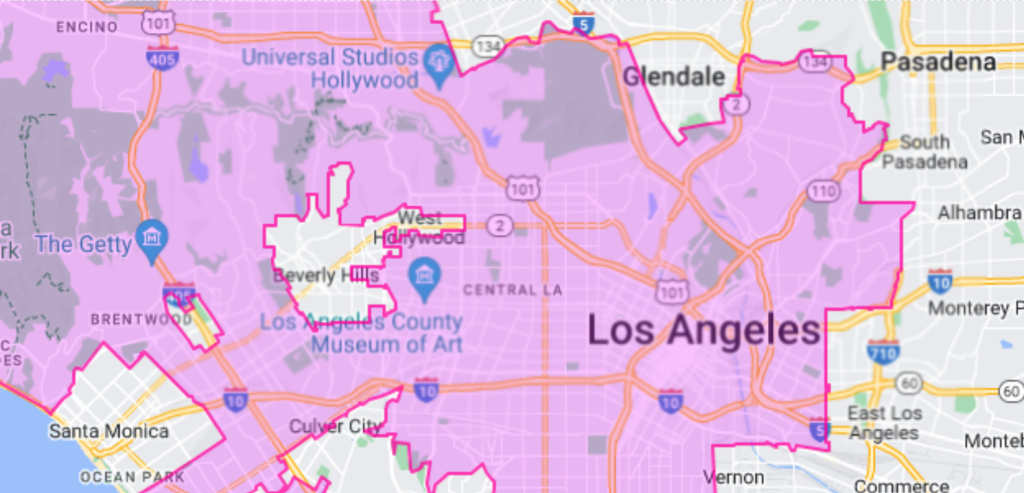
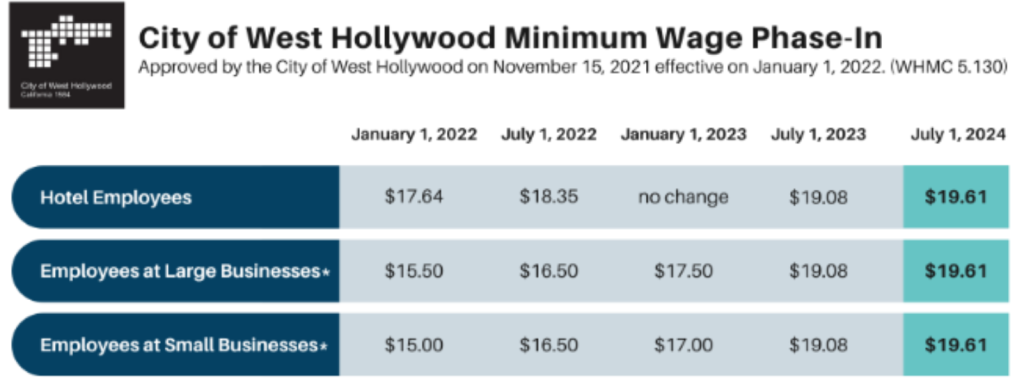
A prominent example is West Hollywood, given its unique position of being surrounded by Los Angeles territory. In West Hollywood, all employees have starting rates of $19.08 for all occupations (as of July 1, 2023).


https://www.weho.org/business/operate-your-business/minimum-wage


For comparison, we can see that the lowest possible starting minimum wage is $16.78 for the city of Los Angeles (as of July 1, 2023). 


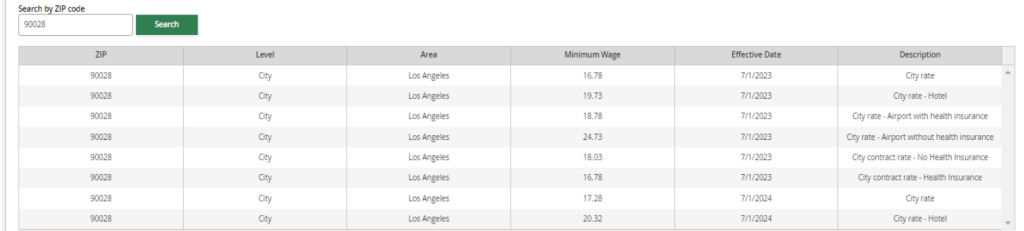
In addition to the base minimum wages displayed on the charts, there are different starting wages for certain industries, as well as specific exceptions, based on the laws of their respective jurisdiction.  

Indexing to Inflation 

Some states have implemented policies where their minimum wage is indexed to inflation, ensuring that it keeps pace with the cost of living as it rises over time. To be more specific, these states adjust and raise minimum wage accordingly based on the year-over-year increases in the Consumer Price Index (CPI). This methodology has been adopted by 19 states and Washington, D.C:

  1. Alaska
  2. Arizona 
  3. Colorado 
  4. Connecticut 
  5. Florida 
  6. Maine 
  7. Minnesota 
  8. Missouri 
  9. Montana 
  10. Nebraska 
  11. Nevada 
  12. New Jersey 
  13. New York 
  14. Ohio 
  15. Oregon 
  16. South Dakota 
  17. Vermont 
  18. Virginia 
  19. Washington 
  20. Washington, D.C. 

Tipping Laws 

In some states, employers are allowed to pay a lower base wage to tipped employees (such as servers or waiters) so long as their total earnings (including tips) meet or exceed the regular minimum wage. These variations can influence the effective minimum wage rates for tipped employees in different states. 

For example, one of the best states for tipped employees is California, which allows them to combine their hourly base wage of $16 with their tips without the total amounts being capped. On the other hand, there are a handful of states that have their tipped wage start at a reduced minimum wage, such as the federal minimum of $2.13 per hour for tipped employees, and their remaining wages will be either covered by tips or the employer. Some of the states with unfavorable tipped worker minimum wage laws are Alabama, Georgia, Kansas, Mississippi, North Carolina, Texas, and Utah.

Final Thoughts

In conclusion, the minimum wage landscape in the United States is a complex web of state regulations, regional disparities, and industry-specific variations. While the federal minimum wage provides a baseline, individual states have the authority to set their own rates, leading to significant differences in compensation amounts across the country. Myriad factors, such as the cost of living, regional disparities, indexing to inflation, and tipping laws, further contribute to the variations in minimum wage rates. Understanding these factors is essential for individuals navigating the job market, as their location and occupation can significantly impact their starting wage and overall financial well-being. 

It is important to note that minimum wage laws are subject to change as state legislatures continue to debate and enact new policies. For the most up-to-date information on minimum wage rates in specific states, it is recommended to consult with official state labor department websites, reliable sources for labor law information, or ERI’s Geographic Assessor.


1 Twenty-two states will increase their minimum wages on January 1, raising pay for nearly 10 million workers. Economic Policy Institute. (n.d.). https://www.epi.org/blog/twenty-two-states-will-increase-their-minimum-wages-on-january-1-raising-pay-for-nearly-10-million-workers/  

2 Minimum wages for tipped employees. DOL. (n.d.). https://www.dol.gov/agencies/whd/state/minimum-wage/tipped 


cost of labor cost of living

Cost of Labor vs. Cost of Living

Why it makes a difference in total rewards

The difference between the cost of labor and cost of living can mean many different things to many people.  In total rewards, it is important to address how cost of labor and cost of living are applied in our profession and business.

Cost of labor is determined by the supply and demand of labor across all industries and occupations by geographic location.  It represents the cost to hire and retain local nationals.  The cost of labor reflects the external labor market’s pay practices for total compensation based on all jobs combined for each geographic location.

Cost of living measures the required costs to maintain a certain standard of living within a geographic location (based on a market basket of goods and services including consumables, transportation, health services, housing, and taxes paid by an employee).  The cost of living can be referenced to compare the cost to live in one city as compared to another city.  It is commonly used to manage relocations as part of a global mobility program.

Cost of labor and cost of living are frequently used to manage these important business decisions:

cost of labor cost of living


What are the differences between cost of labor and cost of living?

Where cost of living is very valuable in managing relocations and temporary global assignments, cost of labor is most valuable in managing ongoing, regular assignments for new hires and existing employees.  This includes developing the compensation strategy, creating salary structures, managing geographic pay, and assessing the cost of conducting business in a location.

A comparison of the cost of living and the cost of labor will always generate very different percentages. For example, the table below compares the percent difference in the cost of living and the cost of labor between the home base of Atlanta, Georgia, and three other locations in Manhattan, Chicago, and Los Angeles:

cost of living cost of labor

For example, Manhattan is 116.9% higher in cost of living and 23.0% higher in the cost of labor than Atlanta, Georgia.

U.S. merit increases are based on the cost of labor and commonly reflect the external labor market based on what other companies plan for their annual pay increases.  Occasionally, cost-of-living increases may be implemented, but they are typically contractual in nature.  Cost-of-living increases are typically based on increases in the consumer price index for a geographic location.

As inflation increases to double digits in a given country, consideration of cost-of-living increases typically become more prevalent.  For example, in the early 1980s, the United States had double-digit inflation with salary increase budgets of over 10%.   During this time, some companies elected to deliver both merit increases and cost-of-living increases, though they were frequently administered on two different dates.  Keep in mind, salary increases frequently trail changes in inflation—they don’t always change at the same time.

You will notice that cost of labor is commonly used for managing core compensation programs for local national employees, while cost of living is used to manage “temporary” relocation pay—especially under international mobility programs.  Occasionally, companies may pay a temporary relocation allowance, when appropriate, for domestic relocations.  Normally, these are phased out over time once an employee adjusts to the new cost of living in the new location.


How can cost of labor and cost of living be used together?

Key business decisions may occasionally require consideration of both cost of labor and cost of living in the analysis.  For example, when a business is considering offshoring, the cost and availability of labor, cost of living, cost of conducting business, business climate, and taxation should all be considered in the decision-making process.

Reliable reference sources, such as ERI’s Geographic Assessor (for geographic labor differentials) and Relocation Assessor (for cost-of-living analyses), are valuable in managing these important decisions as part of your total rewards program.

ERI Economic Research Institute compiles the most robust salary, cost-of-living, and executive compensation survey data available, with current market data for more than 1,000 industry sectors.

ERI’s Assessor Series – solutions for every compensation decision

Try a FREE Demo Request a Guided Tour

Examining Cost-of-Living Differentials at Different Earnings Levels

Relocation and HR Professionals using the Relocation Assessor frequently ask, “Why does the cost-of-living differential change when I increase or decrease the Annual Earnings? Shouldn’t it always be a fixed percentage?” To evaluate COL differential estimates, it is necessary to have an understanding of the underlying expenditures patterns. Since the mid-1980s, the Bureau of Labor Statistics using the annual Consumer Expenditure Survey has produced average expenditures for various family profiles (e.g., earnings level, age, and race).  Survey participants are asked to keep detailed diaries of all spending, and in-person interviews are conducted. The goal is to accurately capture both reoccurring purchases (such as grocery items) and larger expenditures over a period of time (such as a car, rental/mortgage payment, etc.).  Results from the survey demonstrate that, at lower earnings levels, it takes a larger percentage of Annual Earnings to cover the expenditures for Housing, Consumables, Transportation and Health Services for the professional/mid-management lifestyle estimated in the Relocation Assessor data.

Another (more mathematical) way to think about this is that more and more of the typical expenditures are being covered as Annual Earnings increase, so more is available for the Miscellaneous expenditure category. The Relocation Assessor assumes that the Miscellaneous expenditures are equal in both the Base and Destination locations. The “mathematical” explanation follows:  The Miscellaneous category becomes a higher percentage of Annual Earnings as it increases. The COL differential of Miscellaneous is always 0, so an increasing percentage of entire budget is not impacted by a COL differential.  Now consider the “intuitive” explanation:  Does it make sense to offer the same COL differential percentage to an employee making $50,000 as an employee making $500,000?

In the example below, we illustrate with a 900 square foot apartment rental at an Annual Earnings level of $75,000 for a family of two. The COL differential from Atlanta to San Francisco is a 51.7% COL increase. For the same parameters (900 square foot apartment rental and family size of 2), when the Annual Earnings increases to $125,000, the COL differential decreases from 51.7% to 34.3%. If the Annual Earnings is $200,000, then the differential falls to 26.5%.

Here is the generalized explanation:  Expenditure patterns differ based on earnings levels. At lower earnings levels, households typically spend a higher percentage on Housing and Consumables. Further, as income increases, the percentage of Income and Payroll Taxes increase due to the progressive tax structure in the US.

In practice, the HR or Relocation Professional gets this common question from the recipient of a Relocation Assessor report: “I found different data online about the cost of living in my new location. Why is what I found so much higher?” Ask to be provided with the results (the COL differentials) from the source being for several different income levels (perhaps $50,000 and $500,000 in addition to the individual’s salary). If the percentage difference for both (all) salary levels is the same, share the above explanation.

ERI Economic Research Institute compiles the most robust salary, cost-of-living, and executive compensation survey data available, with current market data for more than 1,000 industry sectors.

ERI’s Assessor Series® – Solutions for every compensation decision

Try a FREE Demo Request a Guided Tour