Top 20 Highest-Paid CEOs in Technology

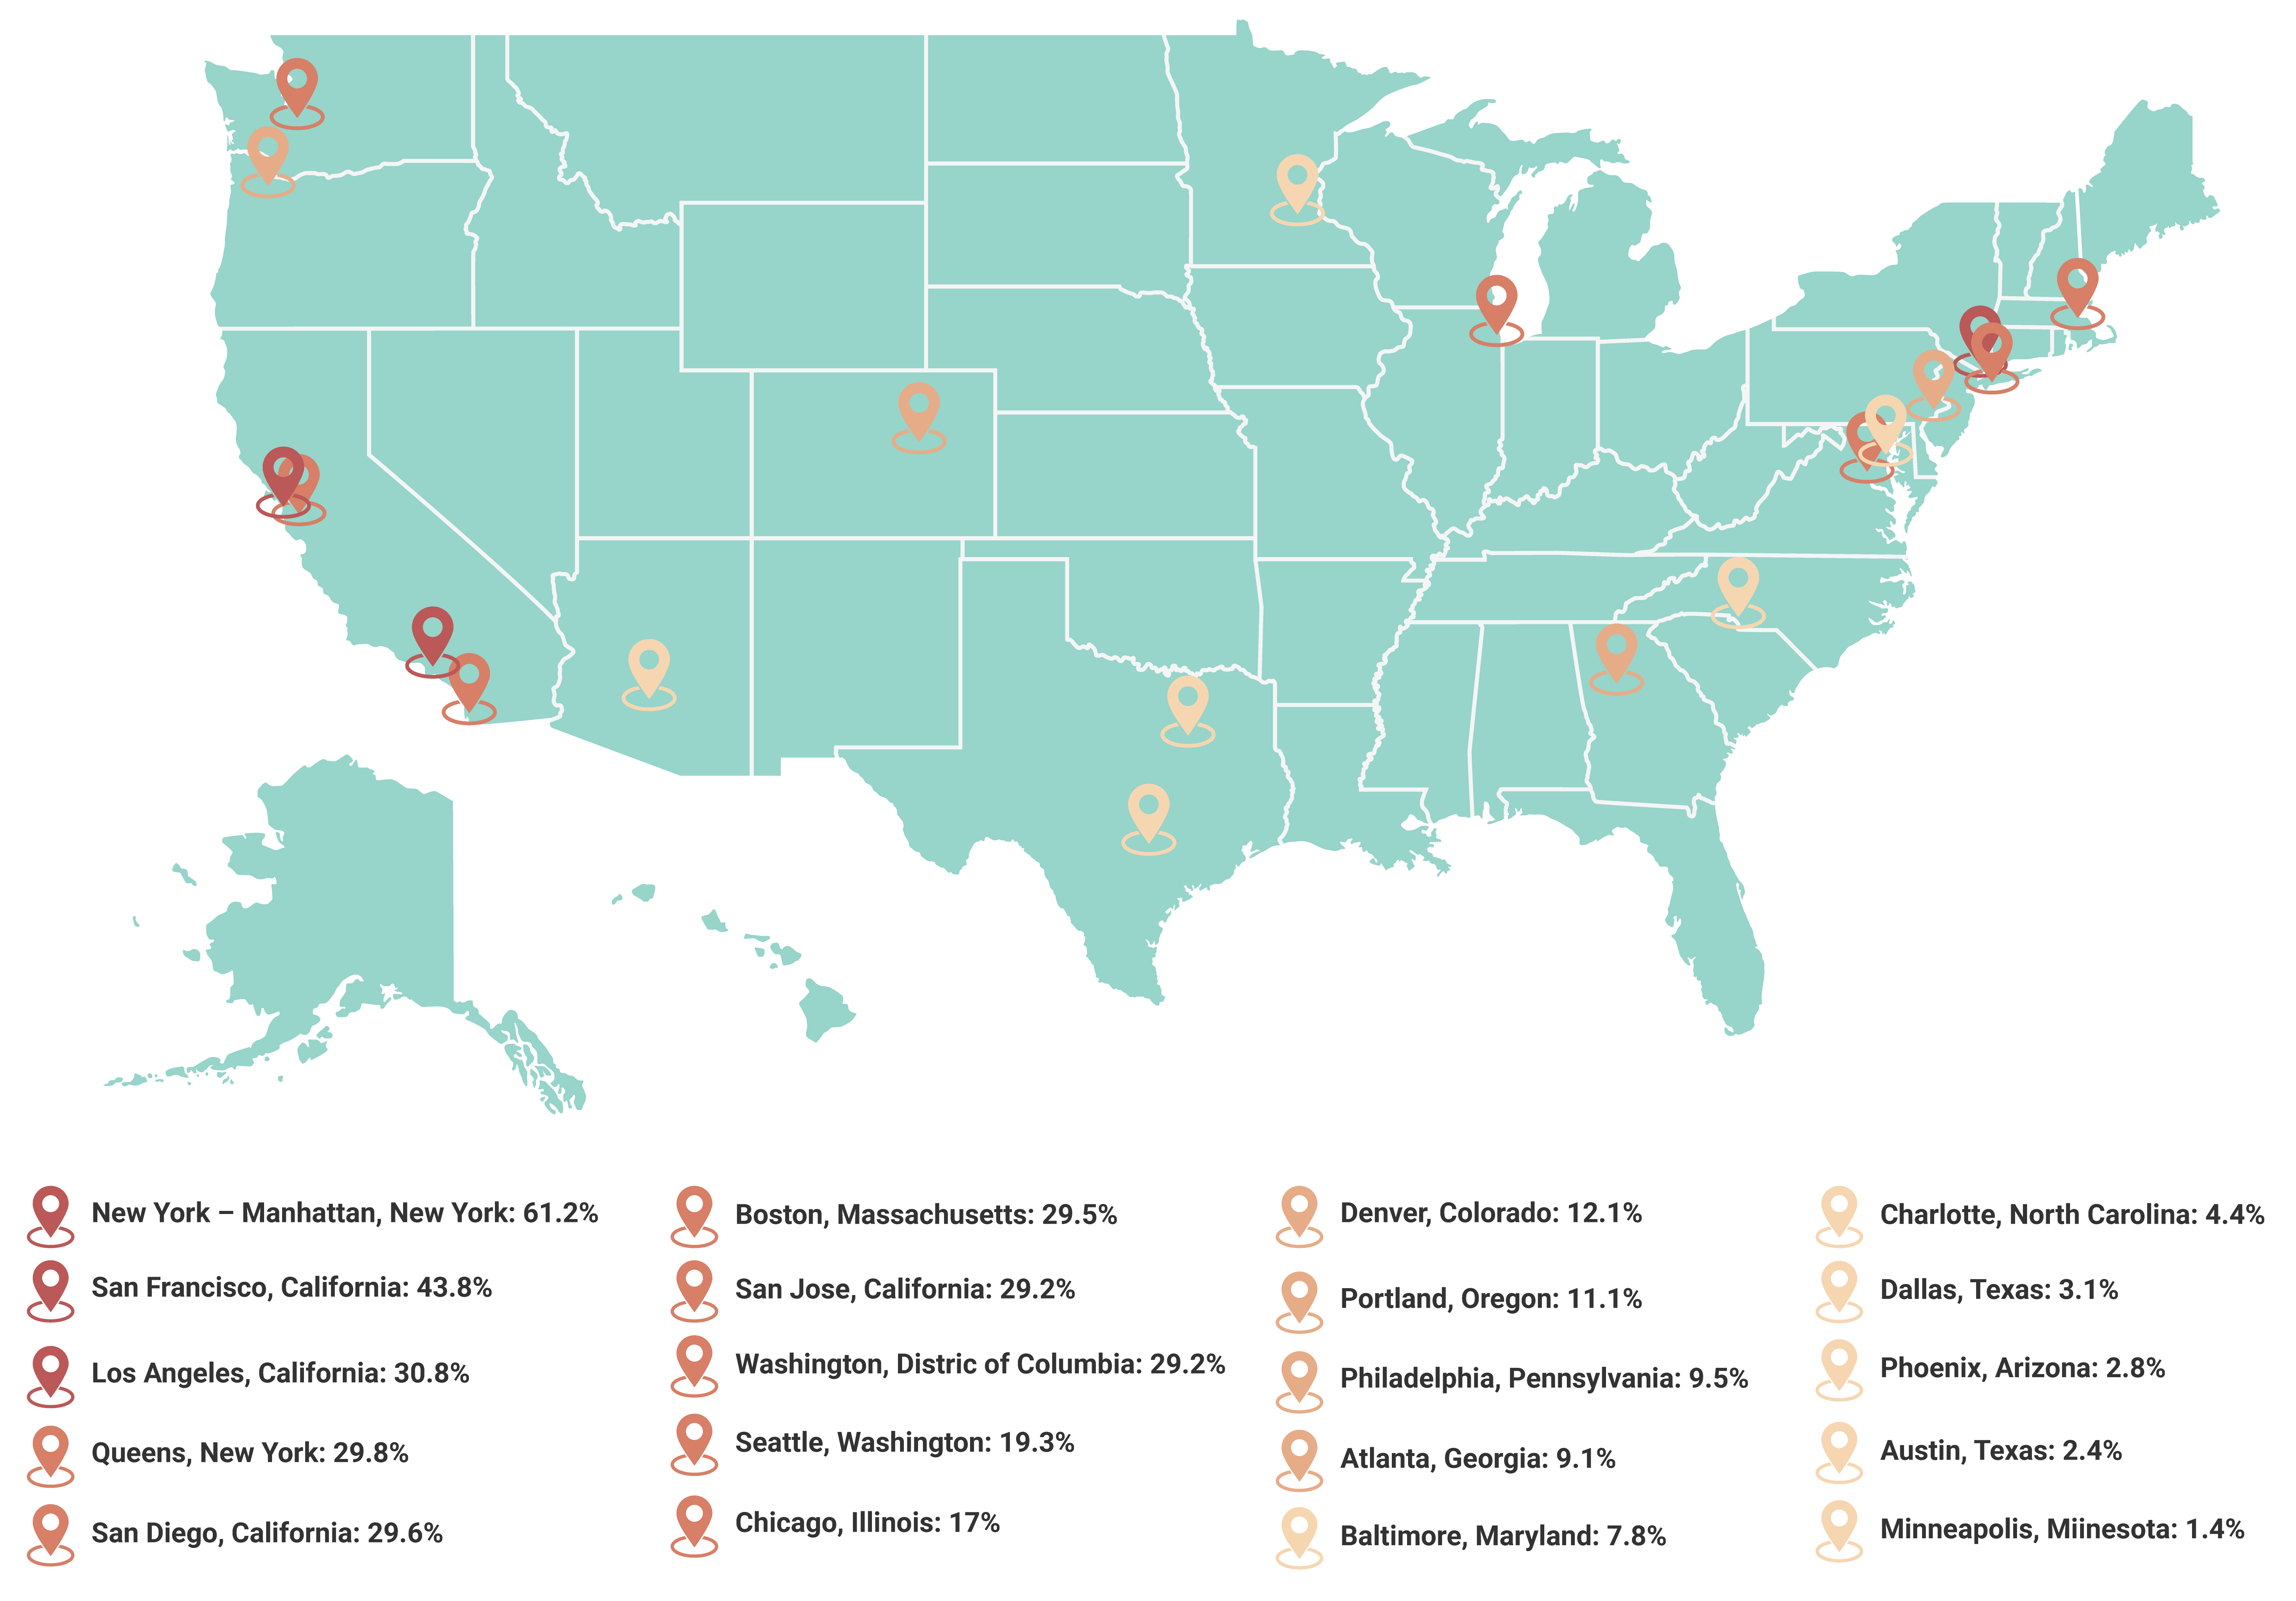
Leaders of the technology industry have a discerning eye for inventiveness and are often admired for piloting the industry towards innovation and ingenuity. Technology leaders are known for their insightful vision, planting the seeds for advancements to take root and thrive in a highly competitive industry. In an ever-evolving industry like technology, HR professionals must rely on current market data to accurately benchmark salaries that attract and retain top talent.

Even in the face of constant transformation, effective tech executives can steer companies towards success. This is what makes them so invaluable and some of the highest-paid executives of any industry—their clever intuition for enterprise is one of the very factors that influence their compensation packages, which are already quite complex.

To understand executive compensation packages for tech CEOs, we must first explore which factors contribute to executive pay and the reasoning behind them. This helps HR and compensation analysts make the most accurate decisions in salary planning.

Technology CEO Total Compensation Factors

CEO compensation in the technology industry is dependent on multiple factors. Beyond their base salary, a tech industry CEO’s total rewards package is typically largely comprised of additional pay components, such as stock awards, additional benefits, and performance-based incentives. Executive compensation is often tied to company performance because of the competitive and fast-paced nature of the technology industry. More than anything, technology is an industry that hinges on risks and investments, which makes clear executive leadership crucial for final decision-making processes.

Highest-Paid Technology CEOs

The technology sector continues to dominate executive compensation, with its top CEOs earning multimillion dollar salaries supplemented by stock awards, bonuses, and other incentives. As tech companies expand their global influence, executive pay packages reflect the intense competition for leadership talent capable of driving shareholder value and encouraging product innovation. The chart below highlights the highest-paid CEOS in the technology industry based on data collected in 2024, in order of highest total compensation, highlighting how base salary factors into the total.

NameCompanySalaryTotal
Satya NadellaMicrosoft Corp$ 2,500,000.00$ 79,106,183.00
Timothy CookApple Inc$ 3,000,000.00$ 74,609,802.00
Matthew MurphyMarvell Technology Group Ltd$ 1,138,698.00$ 45,163,040.00
Marc BenioffSalesforce.com Inc$ 1,550,000.00$ 39,642,173.00
Shantanu NarayenAdobe Inc$ 1,500,000.00$ 52,390,182.00
Charles RobbinsCisco Systems Inc$ 1,390,000.00$ 39,202,654.00
Sasan GoodarziIntuit Inc$ 1,200,000.00$ 36,572,360.00
Timothy ArcherLam Research Corp$ 1,176,923.00$ 30,135,041.00
Sanjay MehrotraMicron Technology Inc$ 1,416,909.00$ 30,060,126.00
Vincent MatteraII-VI Inc$ 1,060,096.00$ 28,811,152.00
Julie SweetAccenture PLC$ 1,550,000.00$ 24,915,146.00
Richard WallaceKLA Corp$ 1,129,905.00$ 22,832,965.00
Vincent RocheAnalog Devices Inc$ 1,137,692.00$ 22,436,615.00
Thierry DelaporteWipro Ltd$ 3,900,827.00$ 20,111,105.00
Michael SalvinoDXC Technology Co$ 1,350,000.00$ 19,821,384.00
David GoeckelerWestern Digital Corp$ 1,245,192.00$ 17,690,772.00
George SchindlerCGI Inc$ 1,921,418.00$ 14,162,558.00
Serge GodinCGI Inc$ 1,301,000.00$ 13,710,280.00
Nazzic KeeneScience Applications International Corp$ 1,258,224.00$ 12,895,917.00
Philip GallagherAvnet Inc$ 1,200,000.00$ 8,775,978.00

This table presents the top 20 highestpaid CEOs based on total reported compensation. While stock awards and performancebased variable compensation form a significant portion of executive pay, base salaries are a fraction of total earnings.

Be mindful that compensation figures may change over time, reflecting market dynamics, company performance, and industry trends. Stay informed of the latest compensation survey data to ensure your salary plan remains up to date and competitive within your industry.

For a more detailed breakdown of executive compensation in technology or other industries, turn to ERI’s Executive Compensation Assessor, which provides a complete analysis of compensation factors at the executive level, including salaries, bonuses, long-term incentives, non-equity incentives, stock awards, option awards, pension, other compensation, and more. ERI’s Assessor Platform is designed to help you customize your executive compensation analysis to confidently grasp how executive salaries compare in your specific industry and make the most accurate data-driven decisions.

Enjoyed this article? Learn more about top executive compensation in various industries at ERI, including the top 20 highest-paid CEOs in health care.

Top 20 Highest-Paid CEOs in Health Care

The health care sector is comprised of multiple sub-industries and diverse professions that work in tandem to provide for and service health needs and concerns. As the health care sector develops and tackles emerging and challenging issues – such as talent shortages, shift differential analysis, and regulatory compliance complexities – it is important for HR professionals to accurately benchmark salaries, particularly at the top executive level, based on current market data and industry trends.  

Despite growing challenges, ERI’s 2025 Salary Increase Survey projects the budget for executive compensation in health care to increase by 3.9 % this year, indicating that salaries for CEOs in health care should remain steady. CEO pay in health care is a complex topic, and the best way to approach it is by first understanding the myriad factors that contribute to executive compensation in this unique industry.  

CEO Compensation in Health Care 

The increase in CEO compensation reflects the complexity of managing and navigating care in an increasingly unpredictable climate, particularly given the impacts of the COVID-19 pandemic, high inflation, government policies, etc. This makes the demand for talented executive leaders critical, as their duties span not only quality and managed care, but also legal services and compliance.  

In general, total compensation packages are dependent on a range of factors, such as the specific sub-industry, geographic location, organization size, and competitiveness. Moreover, salaries are significantly influenced by individual factors, including a professional’s level of education, specialization, experience, and relevant skills and certifications. However, at the executive level, geographic location may not necessarily be a crucial factor in benchmarking executive salaries because these roles are often recruited at the national level from candidates with experience in the industry. In the end, multiple elements determine an executive’s overall compensation package.  

Top 20 Highest-Paid CEOs in Health Care 

Below is a list of the top 20 CEOs in health care based on the most recent complete form year (2024). For this list, base salary serves as the rank-order metric as it is predetermined and the most fixed among the various forms of executive compensation.

First NameLast NameTitleCompanySalaryTotal Compensation
WilliamSiboldDirector, President and Chief Executive OfficerMadrigal Pharmaceuticals Inc$275,400.00$32,268,400.00
AriBousbibChairman of the Board and Chief Executive OfficerIQVIA Holdings Inc$1,800,000.00$29,151,752.00
JosephHoganPresident, Chief Executive Officer and DirectorAlign Technology Inc$1,354,769.00$28,952,411.00
JoaquinDuatoChairman of the Board and Chief Executive OfficerJohnson & Johnson$1,584,615.00$28,397,240.00
DavidRicksChairman of the Board, President and Chief Executive OfficerEli Lilly and Co$1,621,154.00$26,565,732.00
JasonHollarChief Executive Officer and DirectorCardinal Health Inc$1,434,153.00$25,650,709.00
RamiElghandourPresident, Chief Executive Officer and Chairman of the BoardArcellx Inc$600,960.00$24,964,306.00
AlbertBourlaChairman of the Board and Chief Executive OfficerPfizer Inc$1,800,000.00$24,648,727.00
SamuelHazenDirector and Chief Executive OfficerHCA Healthcare Inc$1,539,947.00$23,799,137.00
AndrewWittyDirector and Chief Executive OfficerUnitedHealth Group Inc$1,500,000.00$23,534,936.00
RobertFordChairman of the Board and Chief Executive OfficerAbbott Laboratories$1,500,000.00$23,268,171.00
DavidCordaniChairman of the Board, President and Chief Executive OfficerThe Cigna Group$1,573,077.00$23,251,096.00
RobertBradwayChairman of the Board, President and Chief Executive OfficerAmgen Inc$1,786,977.00$22,643,650.00
DanielO'DayChairman of the Board and Chief Executive OfficerGilead Sciences Inc$1,740,962.00$22,607,690.00
GailBoudreauxPresident, Chief Executive Officer and DirectorAnthem Inc$1,600,000.00$21,889,039.00
KarenLynchDirector, President and Chief Executive OfficerCVS Health Corp$1,500,000.00$21,615,034.00
MichaelMahoneyChairman of the Board, President and Chief Executive OfficerBoston Scientific Corp$1,400,000.00$21,420,801.00
RainerBlairDirector, President and Chief Executive OfficerDanaher Corp$1,300,000.00$20,903,282.00
KevinLoboChairman of the Board, Chief Executive Officer and PresidentStryker Corp$1,391,667.00$20,767,847.00
ReshmaKewalramaniDirector, President and Chief Executive OfficerVertex Pharmaceuticals Inc$1,500,000.00$20,594,441.00

Be mindful that compensation figures may change over time, reflecting market dynamics, company performance, and industry trends. Stay informed of the latest compensation survey data to ensure your salary plan remains up to date and competitive within your industry.  

For a more detailed breakdown of executive compensation in health care or other industries, turn to ERI’s Executive Compensation Assessor, which provides a complete analysis of compensation factors at the executive level, including salaries, bonuses, long-term incentives, non-equity incentives, stock awards, option awards, pension, other compensation, and more. Those interested specifically in nonprofit executive compensation should consider ERI’s Nonprofit Comparables Assessor, which allows you to generate benchmark reports based on salary data from comparable peers in tax-exempt and/or for-profit organizations. ERI’s Assessor Platform is designed to help you customize your executive compensation analysis to confidently grasp how executive salaries compare in your specific industry and make the most accurate data-driven decisions. 

Enjoyed this article? Learn more about top 10 executive compensation in various industries at ERI, including the top 10 highest-paid CEOs at nonprofits 2024 and the top top 10 highest-paid CEOs in the construction industry.   

Cost-of-Living Index by City – January 2025

ERI Economic Research Institute’s Cost-of-Living Index ranks the cost of living for heavily populated U.S. cities using the total cost of essential market basket items for each city indexed against the U.S. average. Rankings are determined by the prices of essential goods and services, including housing, consumables, transportation, health services, and tax obligations, by location.  

The list below is ordered from the highest to lowest cost of living for 20 major U.S. cities as of January 2025. The percentages were calculated using ERI’s Relocation Assessor and are based on the national average for a two-person household with a combined yearly income of $100,000 renting a 900 square foot apartment with one car. 

  1. New York-Manhattan, New York
    The cost of living in Manhattan, New York, is 61.2% higher than the national average. 
  2. San Francisco, California
    The cost of living in San Francisco, California, is 43.8% higher than the national average. 
  3. Los Angeles, California
    The cost of living in Los Angeles, California, is 30.8% higher than the national average. 
  4. Queens, New York
    The cost of living in Queens, New York, is 29.8% higher than the national average. 
  5. San Diego, California
    The cost of living in San Diego, California, is 29.6% higher than the national average.
  6. Boston, Massachusetts
    The cost of living in Boston, Massachusetts, is 29.5% higher than the national average.
  7. San Jose, California 
    The cost of living in San Jose, California, is 29.2% higher than the national average. 
  8. Washington, District of Columbia
    The cost of living in Washington, District of Columbia, is 24.2% higher than the national average.
  9. Seattle, Washington
    The cost of living in Seattle, Washington, is 19.3% higher than the national average.
  10. Chicago, Illinois
    The cost of living in Chicago, Illinois, is 17% higher than the national average. 
  11. Denver, Colorado
    The cost of living in Denver, Colorado, is 12.1% higher than the national average.
  12. Portland, Oregon
    The cost of living in Portland, Oregon, is 11.1% higher than the national average.
  13. Philadelphia, Pennsylvania
    The cost of living in Philadelphia, Pennsylvania, is 9.5% higher than the national average.
  14. Atlanta, Georgia
    The cost of living in Atlanta, Georgia, is 9.1% higher than the national average.
  15. Baltimore, Maryland
    The cost of living in Baltimore, Maryland, is 7.8% higher than the national average.
  16. Charlotte, North Carolina
    The cost of living in Charlotte, North Carolina, is 4.4% higher than the national average.
  17. Dallas, Texas
    The cost of living in Dallas, Texas, is 3.1% higher than the national average.
  18. Phoenix, Arizona
    The cost of living in Phoenix, Arizona, is 2.8% higher than the national average.
  19. Austin, Texas
    The cost of living in Austin, Texas, is 2.4% higher than the national average. 
  20. Minneapolis, Minnesota
    The cost of living in Minneapolis, Minnesota, is 1.4% higher than the national average.


See how ERI's Cost-of-Living Index ranks 20 major U.S. city from the most to least expensive places to live based on the national average.

Cost-of-living differentials are essential to compensation planning and are used to evaluate business or employee relocation, expansion, and remote work. Our Assessor Platform can help you stay on top of cost-of-living changes among cities and analyze cost-of-living differentials based on earnings level, home size, home ownership or rental, family size, number of autos, and automobile value.  

How to Choose a Compensation Data Provider

In a dynamic labor market, strategic salary planning is more important than ever. Effective compensation management, from design to communication and implementation, is key to attracting, retaining, and motivating employees. Compensation decisions must be made based on current, reliable, and accurate salary data in order to set pay that is both competitive and aligned with an organization’s budget. But how should an HR professional choose where to get accurate salary data? This blog considers some of the sources of salary survey data and what to consider in selecting a compensation data provider. 

Comparing Compensation Data Sources 

Free Government Data 

The U.S. Bureau of Labor Statistics (BLS) provides datasets of publicly available economic and labor statistics data. The Occupational Employment and Wage Statistics (OEWS) program is a valuable free resource that produces employment and wage estimates annually for approximately 830 occupations. These estimates are available for the national average, individual states, and both metropolitan and non-metropolitan areas. National occupational estimates for specific industries are also available.  

OEWS data are published annually, with one-third of the database updated each year, so these static wage estimates may not keep up with the latest market trends in a rapidly changing labor market. As OEWS estimates are often used to determine prevailing wage rates, the salaries reported tend to be conservative and may not be appropriate for organizations looking to set competitive pay rates to attract top-tier talent. 

Crowd-Sourced Data 

Thanks to the Internet, employees today have easy access to market compensation data for their jobs. Online survey data prepared for the masses is referred to as crowd-sourced data. As the sources are anonymous and the pay rates reported cannot be verified, free salary calculators using crowd-sourced data are not necessarily reliable. Salary estimates from this source tend to underestimate actual market values. Employees visit crowd-sourced data sites to determine if they are being paid appropriately, and it appears that a large portion of these employees are paid below average.  

Employees raising issues with their employers over their compensation have become increasingly common. In fact, many companies now ask employees to submit an outline of their research and methodology used before they can make an argument that they are underpaid. Free online salary calculators using crowd-sourced data rarely make their methodologies available, leaving you with few answers about data collection and validation methods. So be cautious and keep in mind that these crowd-sourced data providers may also receive revenue from the sale of advertising. They typically have a broad customer base, and integrity of data may not be their highest priority. 

Professional or Trade Association Surveys 

Numerous trade and professional associations conduct annual salary and benefits surveys that are made available to their members. These surveys can be valuable as they capture compensation trends in relevant industries and geographic markets, helping member organizations benchmark pay against their peers.  

A major concern when comparing compensation surveys is whether the job titles and their matching descriptions surveyed adequately mirror each other. Key positions included in surveys, known as benchmark jobs, should meet these requirements: 

  • Represent the entirety of relevant jobs 
  • Exist in the majority of surveyed firms 
  • Be readily definable 
  • Have similar descriptions to one another 
  • Represent quality reference points (concerning difficulty and responsibility) within the job structure 
  • Be widely recognized within the Human Resources community 
  • Be positions that at least some organizations fill using external sources 

Use of trade and professional association surveys requires careful attention to job matching. This involves determining a close match between benchmark job descriptions used in a survey and an analyst’s knowledge of a similar position’s tasks within the organization. Knowledge of internal jobs is achieved via position analyses, the process of collecting detailed information about your internal jobs to ensure that descriptions accurately represent the work performed. So, if you rely on numerous surveys, expect this to be a labor-intensive process. Luckily, ERI’s Occupational Assessor includes a module devoted to position analysis using the Position Analysis Questionnaire (PAQ) and various references to guide you through the process. ERI’s Assessor Platform also includes easy job matching tools to correlate your internal jobs with benchmark jobs in ERI’s database, relieving you of much of this time-consuming process. 

Industry and Job Function Salary Surveys  

Salary surveys can be specific to an industry or a major job function, with specialized surveys reporting on employee benefits or salary increase budgeting, for example. ERI publishes compensation and benefits survey reports for the United States and Canada. Numerous industry-specific and job function surveys are published annually with data from for-profit and nonprofit organizations. Participating organizations include national, regional, and local companies that vary in size from very small to extremely large in terms of revenue. To participate in or purchase any of ERI’s industry, job function, or other specialized surveys, visit www.erieri.com/surveys. With a broad array of surveys available, ERI can meet the unique needs of your organization. 

Due to potential antitrust violations regarding the exchange of salary information, it is important that U.S. salary surveys follow Safe Harbor Guidelines handed down by the Federal Trade Commission (FTC) and the Department of Justice. Under these guidelines, look for salary surveys that comply with these requirements: 

  • Conducted and managed by a neutral third party, such as a consulting firm, trade association, or survey provider 
  • Use participant data that is more than three months old 
  • Have at least five participants for each market-priced job, with no one company representing more than 25% of a statistic 
  • Ensure participant confidentiality through the use of summarized information 

ERI’s industry and job function surveys comply with all Safe Harbor Guidelines, giving you the peace of mind you need when selecting a compensation survey provider. 

Online Salary Survey Databases 

Salary survey databases are typically very robust and include high quality data. ERI’s Assessor Platform is a perfect example, with extensive databases including data from thousands of available salary surveys. Our employer-reported compensation survey database consists of benefits and compensation surveys vetted by our data scientists to ensure maximum accuracy. You can run unlimited salary reports with extensive data for 39,000+ jobs in 1,100+ industries and 10,500+ global locations. The platform makes it easy to customize compensation analyses based on experience, level, or organization size (revenue, assets, fiscal year budget, or organization size), while accounting for premiums based on skills, education, shift work, and certifications (including security clearances). Subscribers can not only accurately benchmark base salaries, incentives, long-term incentives, and total cash compensation at various percentiles, but also manage complex compensation plans and administer benefits using total rewards statements. The salary survey database is updated at least twice each quarter and includes consensus results from the most reliable survey sources.  

Survey Management 

For those interested in using third-party salary surveys alongside an online salary survey database – combining the best of both worlds – turn to ERI’s Survey Management solution to compare ERI Assessor Series data with data from your various third-party surveys.  It includes a customizable survey library to easily import and classify external surveys, apply premiums or discounts to selected survey data, and manage geographic survey markets. You can effortlessly organize, classify, and match internal jobs to your salary survey library. The Survey Management solution also features job-level market pricing tools, including benchmarking, slotting, market adjustment, and market strategy tools. Utilize market comparison tools, such as compression check, peer analysis, and variance from market, to identify and fix problems with structures. You can quickly export your customized survey analyses using a variety of report options. To learn more, schedule a guided tour of our Assessor Platform. 

Conclusion 

Identifying and selecting a compensation data provider requires paying close attention to the accuracy and reliability of the salary survey source. Competitive market salary data should reflect comparable organizations in terms of size, relevant industries, and appropriate labor markets targeting your peers. Check that your salary survey includes similar jobs ascertained via position analysis and careful job matching. Consider the sample size of the dataset, knowing that a larger sample size generally equates to more reliable data. As compensation trends change rapidly, verify that salary data are current and updated frequently. Understand the methodology used to collect and analyze the data, evaluating both the data collection and validation methods used. Reputable compensation data providers, such as ERI Economic Research Institute, should make these criteria transparent, providing accurate data you can trust. 

IRS Announces 2025 Optional Standard Mileage Rates

Effective January 1, 2025, the optional IRS standard mileage rates for operating an automobile (including vans, pickups, or panel trucks) for business, charitable, medical, or moving expenses have been updated as follows:

These standard mileage rates apply to electric and hybrid-electric automobiles and gasoline and diesel-powered vehicles.

Please refer to the IRS Standard Mileage Rates – 2025 published on December 19, 2024, for additional details.


Social Security Administration Announces 2025 Payroll Tax Increase

Effective January 1, 2025, the U.S. Social Security Administration will increase the maximum earnings subject to the Social Security payroll tax by $7,500 (from $168,600 in 2024 to $176,100 in 2025).

Note:  Additional 0.9% Medicare tax withholding on Federal Insurance Contributions Act (FICA) wages greater than $200,000 ($250,000 for married couples filing jointly) in a calendar year (paid by the employee).

Source:  U.S. Social Security Administration

Social Security Fact Sheet

The Internal Revenue Service (IRS) has announced 2025 retirement plan contribution limits, as well. Learn more by taking a look at our recent post highlighting the major changes.

Salary Assessor

Retain employees and attract new talent. Know how much to pay.

Try a FREE Demo

About ERI

ERI Economic Research Institute compiles the best salary, cost-of-living, and executive compensation survey data available.

IRS Announces 2025 Maximum Retirement Plan Contribution Limits

By Linda L. Cox, ERI Economic Research Institute

It’s that time of year once again when the U.S. Internal Revenue Service (IRS) has announced its 2025 limitations on retirement plans for the 2025 tax year.

The 401(k) retirement maximum contribution limit has been raised from $23,000 to $23,500 for elective deferrals in 2025, with the maximum contribution increasing from $69,000 to $70,000 for all sources (employee and employer). Human resources and payroll should update their systems and employee communications, as appropriate, reflecting changes effective January 1, 2025.

The IRS has also announced the Individual Retirement Account (IRA) limits effective January 1, 2025. The IRA retirement annual contribution limit for 2025 remains at $7,000. If you are over the age of 50, then the annual catch-up contribution not subject to annual cost-of-living adjustment remains at $1,000.

*If age 50+ by year end

Additional information and technical guidance may be found in the IRS source documents below:

IRS Announces 401(k) Limit Increases to $23,500 and IRA Limit Remains $7,000

IRS Notice 2024-80

IRS Notice 2024-285

Cost-of-Living Comparisons: Relocating to Austin, Texas

As the capital of Texas and one of the fastest-growing cities in the United States, Austin has become a popular destination for professionals seeking career opportunities, affordable living, and a high quality of life. With its rapid economic growth and booming tech industry, Austin has become a magnet for professionals in all sectors. Cities like San Francisco, New York, and Boston are known for their high cost of living, and many professionals are seeking more affordable, yet thriving, alternatives. Austin offers that balance and the city’s quality of life is a major draw.  

What Does It Cost to Relocate to Austin, Texas? 

In our latest cost-of-living comparison using data from our Relocation Assessor, we examine a family of four relocating to Austin, Texas, from three other major U.S. locations. These analyses are meant as one-to-one comparisons based on replicating a typical lifestyle with an annual salary of $150,000 in each area. We assume that this family owns a 1,200 square foot home with 2 automobiles valued at $80,000. Calculations do not include moving costs. In addition to the total cost-of-living comparison, we have provided differentials for each of the major expenditure pattern components: consumables, transportation, health services, and housing. 


Cost of Living Comparison Austin Texas

Moving to Austin from California 

Replicating a typical lifestyle in San Francisco, California, earning an annual salary of $150,000 only requires you to make $66,993 in Austin, Texas. This makes Austin about 55% less expensive than San Francisco, with housing in Austin costing 67% less. Moving to Austin from California means more affordable transportation, housing, food, and health costs. 

Moving to Austin from Massachusetts  

When moving to Austin from Boston, Massachusetts, you should be making at least $132,155 to maintain the same standard of living. Housing in Austin costs 27% less than housing in Massachusetts.  

Moving to Austin from New York 

Not surprisingly, New York is significantly more expensive than Austin, Texas. With housing prices 65% higher than in Austin, you will only need to earn $75,313 to maintain the same standard of living in Austin. 

How Expensive Is It to Live in Austin, Texas? 


Cost of Living Comparison National Average

Our Austin, Texas, cost-of-living comparisons show why professionals may be seeking relocation to Austin as it offers more affordability overall compared to the other major U.S. cities. Austin is also the least expensive of the cities analyzed when comparing the cost of living to the national average. Although the cost of moving to Austin depends on a lot of factors, understanding the cost of living between cities and how expensive they are compared to the national average can help you make informed decisions on relocation, salary planning, and budgeting. 

Why Use ERI? 

Cost-of-living differentials are essential to compensation planning and are used to evaluate business or employee relocation, expansion, or remote work. Our Assessor Platform can help you easily compare cost of living among cities and analyze cost-of-living differentials based on earnings level, home size, home ownership or rental, family size, number of autos, and automobile value. 

How Does Inflation Affect Salary Increases?

Employers face the challenging task of balancing salary increases with inflation. Inflation impacts the purchasing power of employees, and organizations need to ensure that wages reflect these economic changes to maintain pay equity and a competitive compensation structure. But how much should salaries increase with inflation? What happens when salaries do not keep up with inflation? How do compensation professionals effectively navigate these challenges to maintain fairness, retention, and productivity? 

The Connection Between Inflation and Salary Increases

Inflation is a business cycle phase characterized by abnormally high prices and a decrease in the purchasing power of money. When inflation occurs, the value of money decreases, meaning employees need higher salaries to maintain the same standard of living.  

If wages do not keep up with inflation, then employees may feel the pinch in their daily lives as everything from groceries to housing becomes more expensive. This is why it is essential to regularly assess salary increases within the context of inflation. But this assessment is more complex than simply tying wage increases to inflation percentages. 

How Does Inflation Impact Salary Structures 

Inflation has several direct and indirect consequences for compensation, encouraging organizations to review and adjust salary structures. 

  1. Erosion of Purchasing Power: If salaries do not increase at the same rate as inflation, then employees lose purchasing power, leading to dissatisfaction, reduced motivation, and higher turnover rates. 
  2. Cost-of-Living Adjustments (COLAs): Many companies consider inflation when giving annual salary raises through COLAs. These adjustments help employees maintain their living standards, even as the cost of goods and services rises. However, COLAs often only cover inflation, without necessarily reflecting merit or performance. 
  3. Competitive Compensation: Inflation can also impact an organization’s competitiveness in the job market. If competitors offer higher pay increases to offset inflation, then organizations that do not follow suit may find it difficult to attract and retain top talent. 
  4. Wage Compression: When inflation-driven salary increases are applied across the board, it can lead to salary compression, where the pay gap between newer and long-tenured employees narrows. This can cause dissatisfaction among experienced employees who expect their compensation to reflect their value to the organization. 
  5. Budget Constraints: Compensation professionals must balance salary increases with the company’s budget. Inflation-driven pay increases can place additional pressure on tight compensation budgets, making it crucial to review compensation trends to manage financial budgets effectively. 

How Much Should Salaries Increase with Inflation? 

Organizations may consider inflation adjustments in their compensation planning to maintain competitive pay, attract and retain top talent, and demonstrate that the company values its workforce. It also helps protect the organization from potential wage dissatisfaction or turnover during periods of economic uncertainty. The ideal salary increase to match inflation depends on the inflation rate, the industry, location, and company performance. In the past decade, U.S. inflation has typically hovered around the Federal Reserve’s target of 2%, except for a surge in 2021 and 2022. In some months, inflation topped 7-8%, far exceeding the usual salary increase of 3%. This stark disparity meant that, even with an average 3% salary increase, employees were still experiencing a significant loss in purchasing power. 

*Image Source: The Federal Reserve

Guidelines for Salary Increases in Inflation Periods 

So, how much can salaries increase with inflation during periods of high inflation? There’s no one-size-fits-all answer, but there are a few general principles to consider when adjusting salaries for inflation: 

  1. Examine Gaps Between Cost of Labor and Inflation: Examining the gap between the cost of labor and inflation will help compensation professionals decide whether to adjust salaries toward the high or low end of the pay range. When the cost of labor increases at a faster rate than inflation, offering salaries toward the higher end may be necessary to attract skilled talent and remain competitive. Conversely, if inflation rises faster than labor costs, organizations might adjust salaries more conservatively, focusing on the lower end. Balancing these factors ensures that pay strategies align with market conditions, budget constraints, and employee expectations.
  2. Consider Industry Standards: Salary increases vary widely across industries. High-demand sectors, such as technology, finance, and health care, may need to offer higher increases to stay competitive. Use compensation surveys, market reports, and reliable online databases relevant to your industry and geographical location to help identify industry standards. Consider using ERI’s Assessor Platform to find market rates for jobs by location, industry, experience, organization size, and shift type when planning salary adjustments for inflation.
  3. Performance-Based Adjustments: In some cases, organizations may choose to offer a combination of inflation-driven COLA and merit-based raises. This allows the company to reward high performers while also addressing inflationary pressures.
  4. Regional Considerations: Inflation can also vary significantly by region. For instance, areas with high housing and living costs may experience sharper inflation than other regions. Compensation professionals should consider regional cost-of-living changes when adjusting wages for inflation. 

Consequences of Salaries Not Keeping Pace with Inflation 

When salaries do not keep up with inflation, organizations can face some consequences:

  1. Employee Dissatisfaction and Turnover: When employees’ salaries do not keep up with inflation, their ability to afford basic necessities diminishes, causing decreased morale, reduced engagement, and higher turnover. In addition, when considering the true cost of an employee, the loss of institutional knowledge can be detrimental to an organization’s productivity and financial health. Employees may start seeking opportunities at companies that offer better compensation packages, which can leave organizations facing retention challenges. 
  2. Reduced Productivity: Financial stress is a significant factor in employee well-being. When employees are worried about making ends meet, their ability to focus and perform effectively at work may diminish. As a result, companies may see a decline in productivity when salaries do not keep up with inflation. This would be a suitable time to conduct employee engagement surveys. They can help employers understand what employees want to see from organizations, which may guide decisions when adjusting salary structures.
  3. Negative Impact on Company Reputation: Companies that fail to adjust salaries in line with inflation may also face reputational risks. If word gets out that a company is not adjusting compensation to reflect economic realities, it could harm the brand and make it challenging to attract skilled workers. 

Use ERI to Manage Inflation and Salary Increases 

Managing salary increases in the face of inflation is a complex and data-driven task for employers. ERI’s Assessor Platform can play a critical role in easing the salary planning process. Here are some ways in which our Assessor Platform can help organizations:  

  1. Streamline Compensation Management: Employers can streamline the compensation management process and adjust salaries based on inflation, performance, and market conditions. By automating salary review processes, compensation professionals can ensure that increases are equitable, consistent, and aligned with company policies.
  2. Make Data-Driven Decisions: With reliable and current compensation data, employers can find accurate market rates for jobs and make informed decisions based on industry trends, inflation data, and internal performance metrics.
  3. Manage Budget Constraints: Organizations can model different scenarios considering inflation rates, employee performance, and financial constraints. This enables employers to make adjustments that meet employee needs and budget goals.
  4. Ensure Compliance and Fairness: Ensure compliance with labor laws, identify any potential pay disparities, and make sure that salary increases are applied consistently across the organization by keeping track of historical data on raises. This transparency is crucial for maintaining employee trust and fair compensation practices. 

With ERI, organizations can make data-driven decisions, manage salary increases effectively, and ensure that compensation strategies remain competitive and fair. As inflation continues to fluctuate, staying ahead of these trends will be critical to building a resilient and motivated workforce. 

Comparing Minimum Wages to Median Wages

A Worldwide Look at Comparing Minimum Wages to Median Wages

The practice of setting a required minimum wage is present in most nations across the globe. Minimum wage is important to ensure that workers are compensated fairly for their labor and can meet their basic living needs. It can help reduce poverty and income inequality, promote decent working environments, and increase the standard of living for workers. Some nations will use a minimum wage to ensure that their lowest paid workers are guaranteed a base earnings level that would not otherwise occur, while, in other countries, unions, market forces, or other factors are more important in keeping up the wages of the lowest-paid workers. 

Since the minimum wage acts as a wage floor, the pay below which wages cannot fall, it is less in value than the median wage, the middle point of wages that workers earn nationally. This is an important aspect to consider for setting wages internationally. In some countries, the median wage is at, or just above, the minimum wage; whereas, in other countries, the median wage is far higher than the minimum wage, which serves as an absolute wage floor that few workers are actually paid. There can be exceptions to the minimum wage, and it can even be limited to certain regions within a state or country, such as counties and cities having specific minimum wage rates.  

The difference between the minimum wage and the median wage can be expressed as a ratio, which varies by country. Upon closer inspection of the minimum-to-median wage ratio between countries, we can discern interesting relationships between the ratio and other economic factors such as: 

  • Gross Domestic Product (GDP) per Capita  
  • Human Development Index (HDI) 
  • Gini Income Inequality Coefficient 

This blog explores these relationships to provide a deeper understanding of minimum wage versus median wage on a global scale.

Minimum Wage Compared to Median Wage by Country

Figure 1: Displayed above is a chart of the countries selected from the Global Salary Calculator for analysis in this blog, ordered by the ratio of their minimum wage to their national median wage. This ratio allows for cross-country comparisons without having to convert to a common currency.

Gross Domestic Product (GDP) per Capita 

Below is a chart of a selection of countries present in ERI’s Global Salary Calculator. The countries are plotted based on the distance of each country’s minimum wage to its median wage, compared with the gross domestic product per capita of each country. 1 The data follow a correlation coefficient of r=0.64 (when transformed for nonlinearity), indicating a moderate positive correlation between the ratio of minimum wage to median wage and the GDP per capita of each country. 

GDP vs. Minimum-to-Median Wage Ratio

Countries on the very low end of the spectrum for GDP per capita (USD 20,000 and below) largely have lower minimum-to-median wage ratios, anywhere from 15% to 35%. This means that the minimum wages in these countries are about 15% to 35% of the overall median wage in each country. Middle-income countries in the $20,000-$40,000 range seem to coalesce around a wage ratio of 40%, while higher-income countries ($40,000 and greater) generally fall in the 50%-70% range. An exception to this latter point is the United States, which, despite its high GDP, has a wage ratio of about 25%, which is more in line with countries on the lower end of the GDP scale, such as Chile or Colombia.  It is worth mentioning, however, that the wage ratio for the U.S. is based on the federal minimum wage – many states and municipalities within the U.S. have significantly higher minimum wages than the federal rate. 

Notably, the marginal increase in the minimum-to-median wage ratio for each segment of GDP per capita levels off once GDP per capita reaches about $30,000. From this point, most countries in the selection have wage ratios between 40% and 60%. 

Human Development Index (HDI) 

Next, we look at the minimum-to-median wage ratios as they relate to each country’s Human Development Index (HDI) score.2  The HDI attempts to measure the degree of development in a given country. Higher scores indicate that a country is more developed, whereas lower scores indicate less development.  

It initially appears that the higher a country’s HDI score, the closer their minimum wage is in value to the country’s median wage. Here, we see a correlation coefficient of r =0.69, a moderate positive correlation, which is more positively correlated than the previous example that showcased the GDP per capita factor. Most countries in the selection that have HDI scores of 0.9 or greater have wage ratios that fall in the range of 50% to 70%, with some outliers that have significantly lower wage ratios. Countries with HDI scores below 0.9 appear to not follow the trend line as consistently as the more highly developed countries.

HDI vs. Minimum-to-Median Wage Ratio

Gini Income Inequality Coefficient 

Lastly, we examine the minimum-to-median wage ratio through the lens of the Gini income inequality coefficient, which measures the distribution of incomes in a population.3 A higher Gini income inequality coefficient indicates an overall higher level of income inequality, whereas lower coefficient values indicate overall lower levels of income inequality. Here, we see a correlation coefficient of r =-0.64, which implies a moderate negative correlation; the more income inequality a nation has, as measured by the Gini income inequality coefficient, the lower their minimum wage is relative to their median wage. Several countries, such as Belgium, Portugal, Jamaica, Ecuador, and Brazil, closely follow this trend line. A notable outlier is Kazakhstan, which has a Gini coefficient that would imply a minimum-to-median wage ratio close to the 50%-60% range, but instead finds itself with a much lower ratio of approximately 18%.

Gini Income Inequality Coefficient vs. Minimum-to-Median Wage Ratio

Final Thoughts 

Essentially, countries that are wealthier, more developed, and more evenly spread in terms of income distribution nationwide tend to have a closer relation between minimum wage and national median wage. Countries that are low in wealth, less developed, and highly skewed in terms of income distribution appear to have relatively low minimum wages in comparison with the median wage. While any causation naturally cannot be inferred from the above correlations, the various factors explored in this blog may inspire ideas or questions, perhaps leading to further examination and research in this area. 

How to Use ERI in Your Compensation Planning 

Compensation professionals can further their global compensation planning and minimum wage research using ERI’s Assessor Platform. ERI provides not only global compensation data but also detailed minimum wage information at the federal, state/province, and local levels in the U.S. and Canada to assist with your compensation management. We provide up-to-date minimum wage data, such as the minimum salary thresholds required to qualify for exemption, local and state pay transparency rules in the U.S., and the ability to search for current and planned minimum wage rates for major cities, counties, and municipalities. With ERI’s reliable minimum wage data, you can stay on top of minimum wage changes to ensure that your organization complies with local labor laws, adheres to applicable regulations, and can strategically plan and budget for minimum wage increases. 

 The correlation coefficient represents the strength of the linear relationship between two variables. An value of 1.0 represents a perfect positive correlation, r=-1.0 represents a perfect negative (or inverse) correlation, and r=0 represents no linear correlation whatsoever. 

  1. World Economic Outlook Database. International Monetary Fund (IMF). https://www.imf.org/en/Publications/WEO/weo-database/2024/April
  2. Human Development Report 2023-2024. United Nations Development Programme. https://hdr.undp.org/content/human-development-report-2023-24
  3. Gini index. World Bank Group. https://data.worldbank.org/indicator/SI.POV.GINI/?skipRedirection=true&view=map