
Looking to Benchmark Pay?
Example of Coefficient of Determination
Consider the following 2 cases:
- Executive compensation vs. company revenue
- Factory worker compensation vs. company revenue
The correlation coefficient (r) of:
- executive compensation vs. revenue is 0.95
- factory worker compensation vs. company revenue is 0.2
To find R2, square the correlation coefficients.
(0.95)2 = 0.9025
(0.2)2 = 0.04
This results in an R2 of 0.9025 for executive compensation vs. company revenue, compared to an R2 of 0.04 for factory worker compensation vs. company revenue.
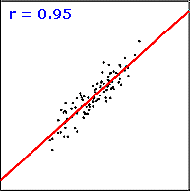
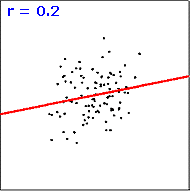
vs. company revenue
Interpretation: 90% of the variation in executive compensation can be attributed to differences in company revenues, while only 4% of the variation in factory worker compensation can be attributed to differences in company revenues. This means company revenue is NOT a good predictor of factory workers' compensation.
Memory Jogger
An executive compensation vs. tenure (years with the company) correlation graph shows a correlation coefficient of 0.32. What may you conclude?