
Looking to Benchmark Pay?
How to find the least squares line
To find the least squares line for a set of data, you must find the intercept
 and slope
 which are
least squares estimates of the population parameters b0
and b1.
which are
least squares estimates of the population parameters b0
and b1.
For the sample of 5 data points in the table above, the fitted line is represented as:
 =
=  +
x
+
x
The "hats" is read as "estimator of." In this case,
is the
estimator of the mean value of y.
and
are estimators
of b0
and b1.
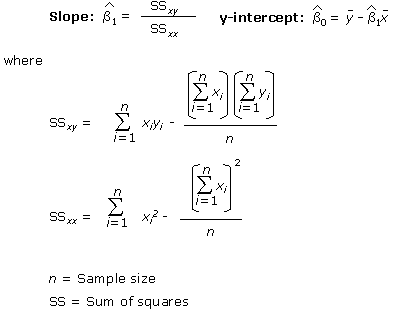
Least square estimates can be expressed mathematically as:
It should be noted that the higher the correlation (r) between x and y, the better the line will fit the data. The purpose of regression is to extract all possible information from the data. The regression model should explain as much as possible about the underlying process. However, due to real world uncertainty, no model will explain everything. The information in the data that are not explained by the regression model is the error component called residuals.
For more information on least square models, refer to statisticshowto.com.
The random error (e) component of the regression equation is assumed to be zero. For more information on random error, refer to Regression Analysis Assumptions.
Memory Jogger
The information in the data that is not explained by the regression model is called: