
Looking to Benchmark Pay?
REGRESSION ANALYSES
In compensation administration, information such as the salary or benefits levels offered by other companies are often of interest to human resource professionals. Using sampling techniques discussed in DLC Course 09: Fundamentals of Compensation Quantitative Methods, you can select random samples of salaries or benefit levels and use their means to predict the salary or benefits level of interest to you. However, this technique leaves out important factors that affect salary and/or benefits. For instance, experience, performance levels, company size and revenue, etc., play important roles in salary determination.
Regression analyses allow human resources professionals to consider all these factors in setting pay and benefits levels.
- Linear regression allows you to make predictions of any dependent variable (y) based on any independent variable (x).
- Multiple linear regression allows you to make predictions of any dependent variable (y) based on several independent variables (xi).
Linear Regression
We will first discuss how to conduct linear regression analyses.
Straight-line model
On a graph of the variables, each independent value (x) is plotted on the x-axis (horizontal line) and each dependent variable (y) is plotted on the y-axis (vertical line). Each x value and its related y value make up the coordinates of each point. After all the points have been plotted on a graph, the result is known as a scatter plot.
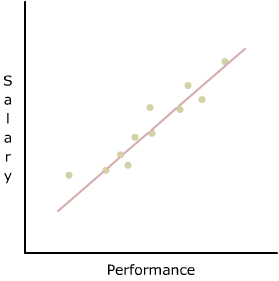
A scatter plot helps to visualize the relationship, if any, between the x and y variables.
When this relationship is linear, as it is above, and the two variables (x and y) are related; then it is possible to predict values of y from various values of x. This prediction comes from finding the straight line that best fits the data.
Memory Jogger
A straight-line model allows you to: