
Looking to Benchmark Pay?
Transformations
In your regression analysis, sometimes, you will not be able to fit a linear line through the distribution of data points in the graph. For example, consider the following graph:
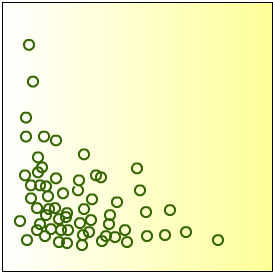
Data points are clustered in the bottom left corner of the graph. Fitting a line through the above data points would give you the following:
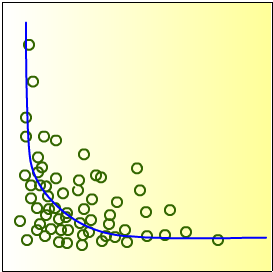
This graph does not allow you to make very good predictions. There are larger variations in y for the smaller x values than for the larger x values. For example, a one-unit increase in x at the left-hand side of the above graph would give you a large decrease in y. However, a one-unit increase in x at the right-hand side of the graph would give you a very small decrease in y. In these cases, transformation is used to achieve linearity and constant variance over the range of response values.
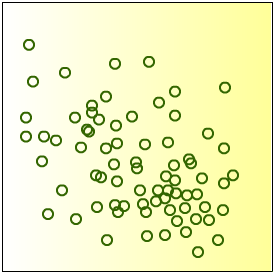
In transformation, often the y variable is transformed first to achieve constant variance over the range of response values, and then the x variable is transformed to achieve linearity. Several types of transformation can be performed, depending on the original structure of the data distribution. Some frequently used transformations are:
- Logs
- x2 or y2
- Square root x or square root y
- 1/x or 1/y
Outliers
Sometimes outliers can also skew a regression line. Outliers are observations that lie far from the main body of the distribution. Histograms can be used to identify outliers. Outliers may result from measurement errors (such as typing errors), or it may be that there are observations that are very different from the rest of the dataset. Outliers must be treated with care. If the outlier is a result of a measurement error, it may be discarded from the dataset. Otherwise, more careful examination of the observation is required. You must first determine the origin of the outlier before you decide whether to include or discard the outlier.
Exercise Question
In transformation, often the y variable is transformed first to: