
Looking to Benchmark Pay?
Line of best fit
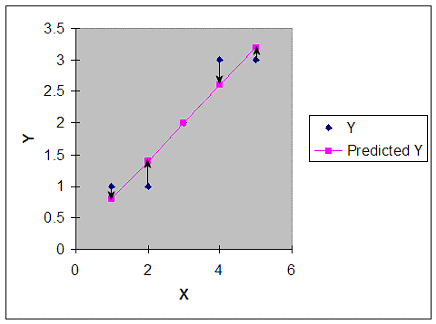
The line of best fit is the line that produces the best estimate of y based on any given value of x. One way to decide quantitatively how well a line fits the data points is to calculate the extent to which the data points deviate from the line. This deviation or error is the vertical distance between the data point and the line. If you take the deviation or error for each of the data points, square them, then add them together, you have a sum of squared errors (SSE). The line that produces the smallest SSE is the line of best fit.

|
denotes the predicted value of y. The residual, or error, equals y -
.
|
The best-fit line is the line with the smallest SSE (sum of squares of the errors), which is a measure of the extent to which the data points deviate from the line. Using the graph above, the data can be summarized as:
| X | Y | Predicted Y | Residuals | Squared Residuals |
|---|---|---|---|---|
| 1 | 1 | 0.8 | 0.2 | 0.04 |
| 2 | 1 | 1.4 | -0.4 | 0.16 |
| 3 | 2 | 2 | 0 | 0 |
| 4 | 3 | 2.6 | 0.4 | 0.16 |
| 5 | 3 | 3.2 | -0.2 | 0.04 |
| Sum = | 0 | 0.4 |
The sum of errors equals 0, and the sum of squares of the errors (SSE) equals 0.4. Drawing different lines through the above graph would result in different values for sum of errors and SSE, but the only line with the smallest SSE would be the above regression line with an SSE of 0.4.
Memory Jogger
A line of best fit is a line with a sum of squares errors that is: