
Looking to Benchmark Pay?
Least Squares Model
The least squares method is used to find the straight line that best fits the data. It is based on the principle that a line of best fit, or one which describes a relationship between two variables best, is a line for which the sum of the squares of the deviations or differences between values on the straight line itself and the actual values will be at a minimum. Only one line of the infinite number available may be drawn to meet this requirement. The line of best fit must be computed mathematically, and it will always pass through the point:
The equation for this line is best expressed as:
y = b0 + b1x + e
| y | dependent variable |
| x | independent variable or predictor (used as a predictor of y) |
| e | random error or residual (actual y value - predicted y value) |
| b0 | y-intercept |
| b1 | slope |
We can use this equation to predict any y value when we know the value of x. A graphical representation of this equation is below:
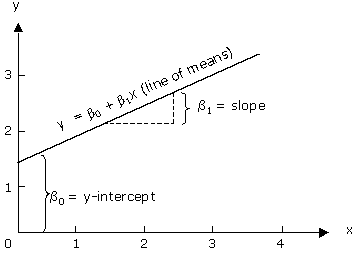
One can visually approximate the position of a line of least squares through data plots by calculating the means of both axes. Regression lines always pass through these two means on any data plot.
Memory Jogger
A line of least squares: