
Looking to Benchmark Pay?
DISTRIBUTIONS
Before we begin our exploration of regression, you must first understand some fundamentals of quantitative methods, including:
- Distributions
- Standard Deviation
- Standard Error
- Correlation
Normal Distributions
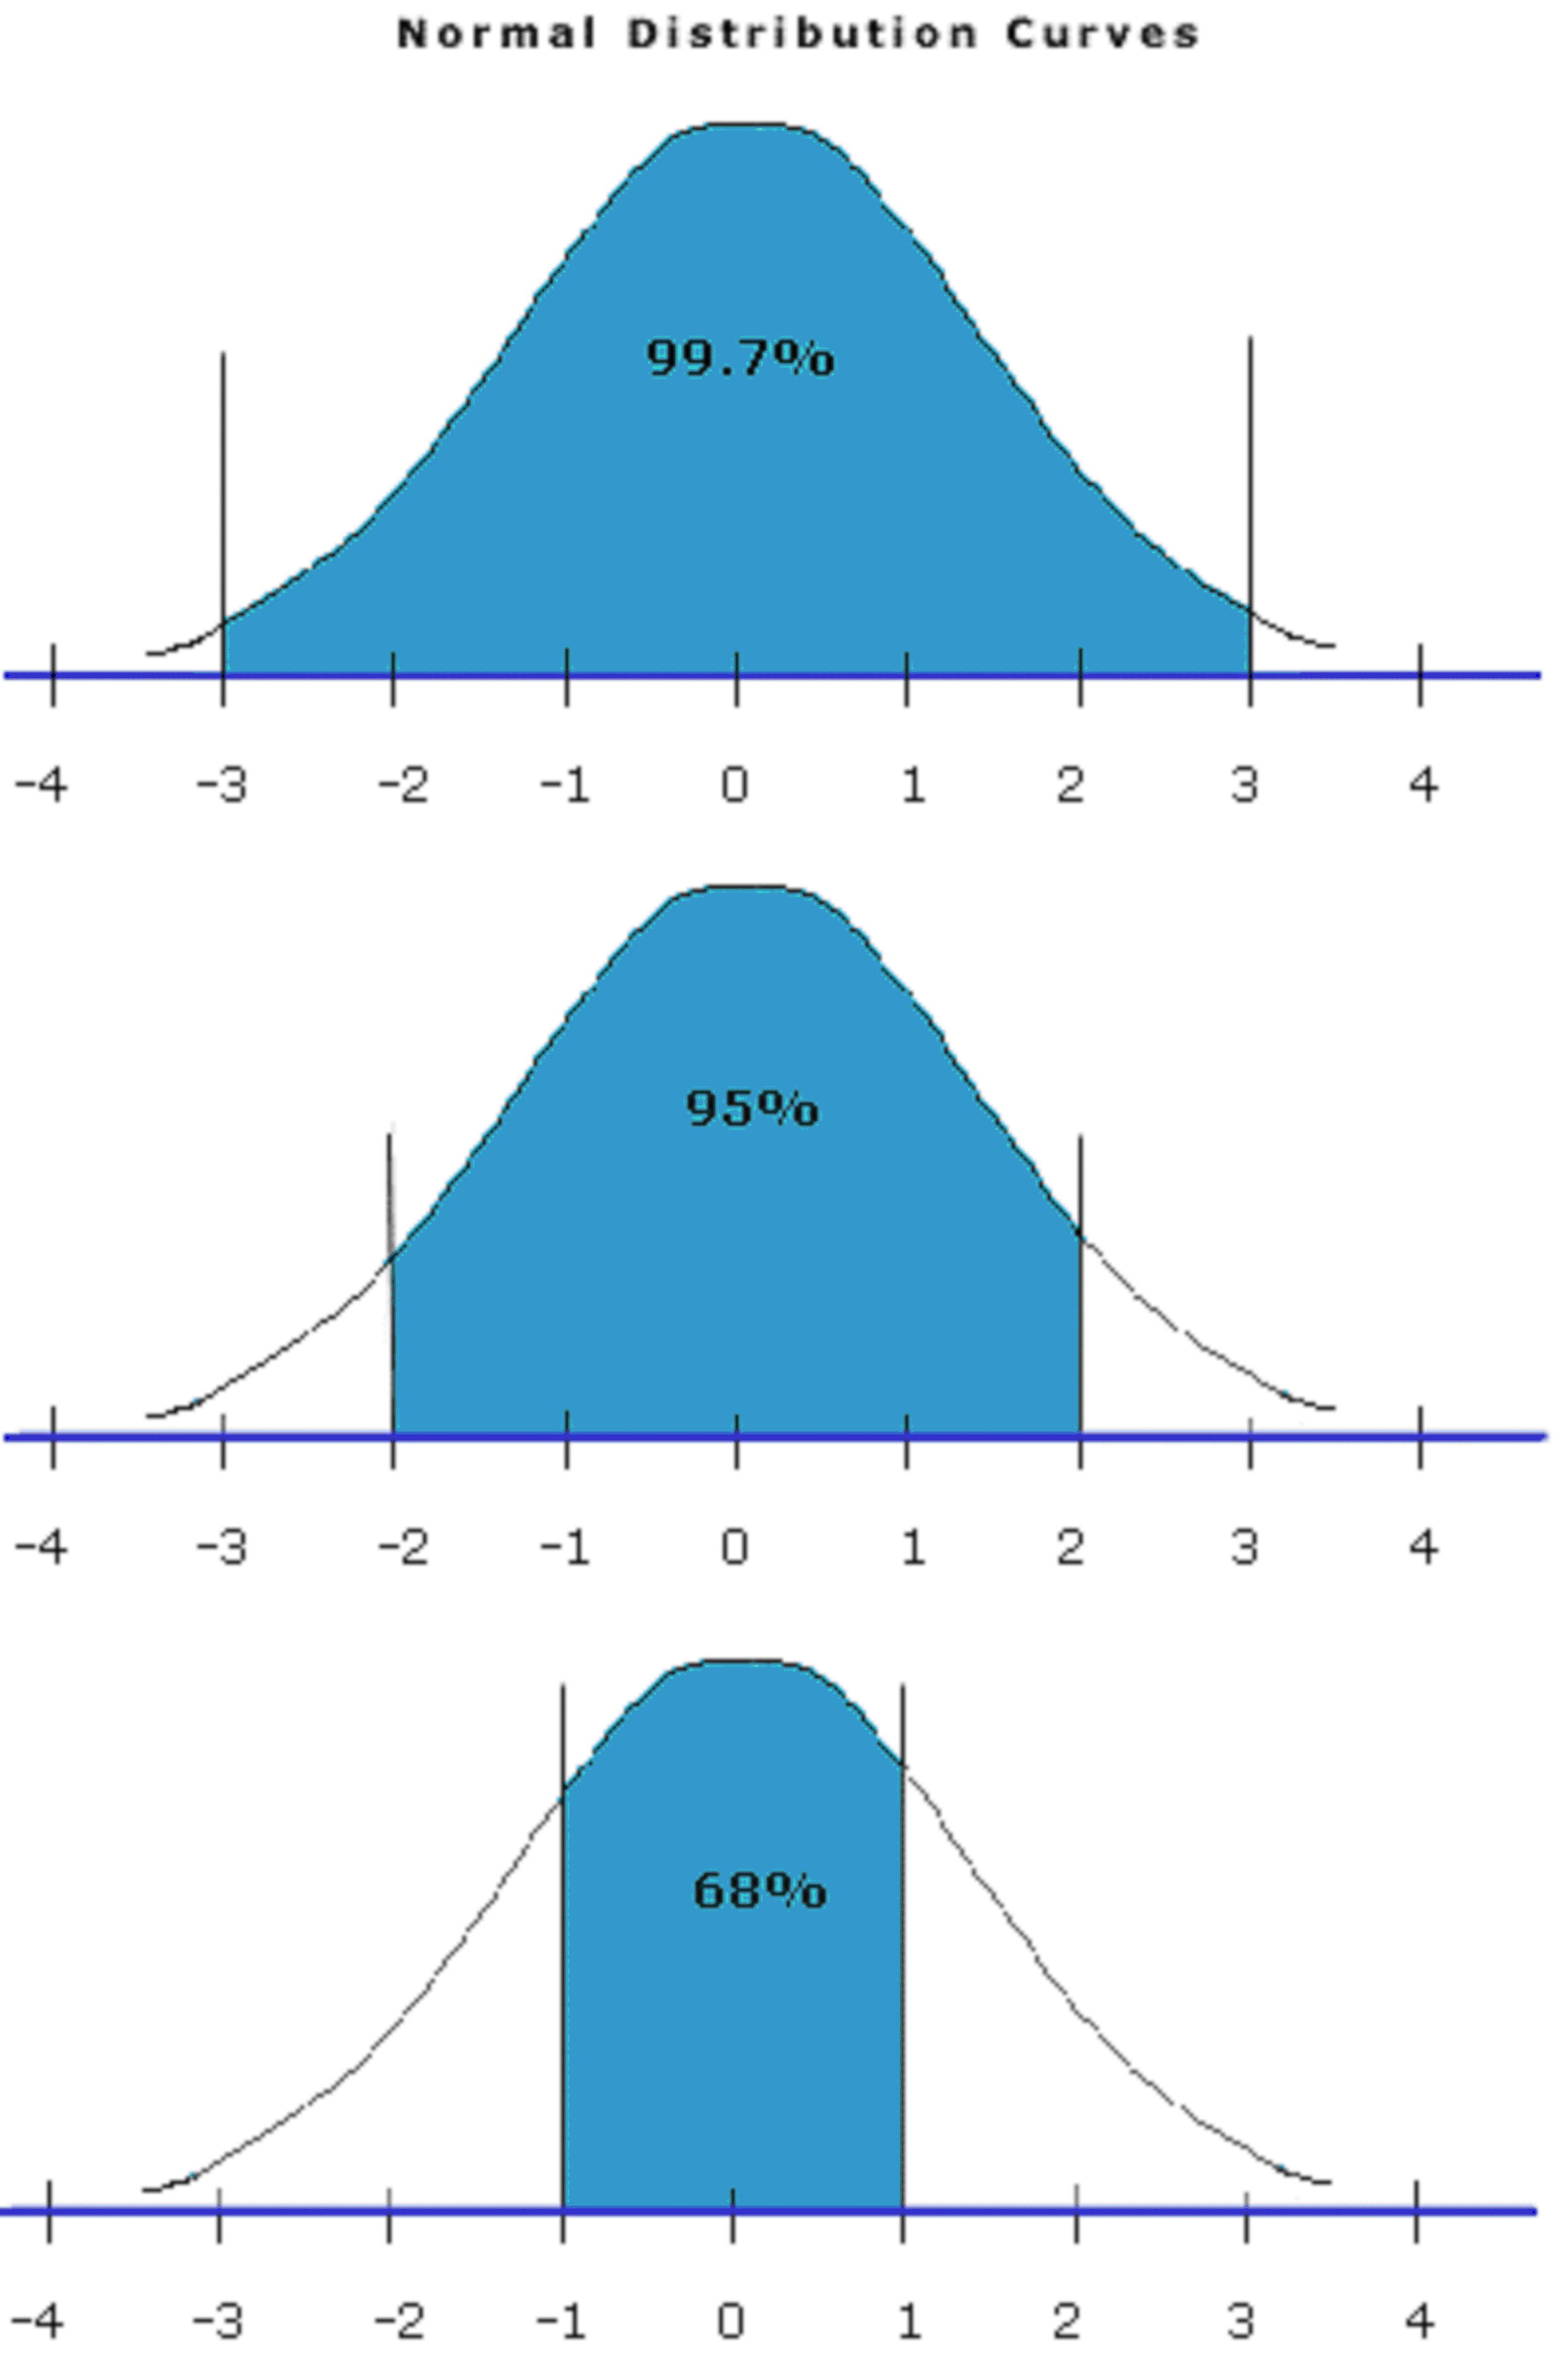
Referred to as a "bell shaped curve," normal distributions represent a standard distribution and are a model around which many statistical tests have been devised. When a distribution from the real world matches a normal distribution, these tests can then be transformed to describe the "real world model."
A distribution with a mean of 0 and a standard deviation of 1 is referred to as the standard normal distribution. (Refer to davidmlane.com/hyperstat/A75494.html for more information on normal distributions.)
A normal distribution curve has the following characteristics:
- a single peak at the center
- symmetry around its peak
- never touches the x-axis
- area under the curve equals 1
For a standard normal distribution:
- 68% of the numbers are between -1 and 1
- 95% of the numbers are between -2 and 2
- 99.7% of the numbers are between -3 and 3
Skewed Distributions
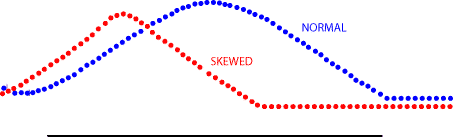
Often the top of the curve will be displaced to the right or left. This is known as a "skewed distribution." Annual salaries, for instance, are reported by international organizations in terms of median salary. The median salary reflects more closely the typical salary than the mean (or average) salary. This is because most wage earners tend to receive salaries that are at the lower end of the scale of all possible salaries. Thus, a mean salary statistic would place an undue weight on salaries that are far up on the scale - of which there are relatively few (i.e. higher paid positions.) This is defined in statistics as the "skewness" of the distribution.
Frequency Distributions
Frequency tables allow us to display data graphically to get an idea of the shape of the distribution. The basic layout of a frequency table is a listing of possible values (or ranges of values) in one column and the frequency of occurrence of each value in another column.
Tally sheet
One convenient method for doing this is to set up a "tally sheet." The tally sheet is a summary sheet consisting of all possible categories within a range of observed values.
| CEO SALARIES* | ||
|---|---|---|
| U.S. DOLLARS | MEN | WOMEN |
| $100,000 - $200,000 | 8 | 57 |
| $200,000 - $300,000 | 28 | 17 |
| $300,000 - $400,000 | 42 | 6 |
*The numbers used are for illustration purposes only.
In the above tally sheet, there are 3 salary categories:
- $100,000 to $200,000
- $200,000 to $300,000
- $300,000 to $400,000
The tally sheet summarizes the occurrence of events (how many men and how many women receive a specified salary in each category).
Refer to http://davidmlane.com/hyperstat/A26308.html for more information on frequency distributions.
Memory Jogger
Note: Memory Jogger questions are not scored. They serve only to help you remember some of the course material covered thus far. You must select the correct answer in order to proceed to the next section.
In a normal distribution curve, the graph: