
Looking to Benchmark Pay?
CORRELATION
Sometimes it is useful to set pay based upon measurable factors such as past performance level or education. In this case, correlation may be used to determine the linear relationship between these factors and pay level.
Correlation is a measure of the association of values of x and y. That is to say, correlation does not measure "causality," but it does show the extent to which you are likely to find a given value of y (say weight) when you know the value of x (say height). The taller a person is, the more they are likely to weigh.
For instance, statistically, there is a high degree of correlation between CEO performance and company revenue. However, there is no indication that one causes the other.
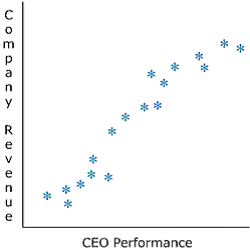
Correlation coefficient is a measure of the dispersion of data points around a straight line. It is measured on a scale of -1 to 1.
- 1 = positive correlation
- -1 = negative correlation
- 0 = no correlation
| Correlation Coefficient | Behavior |
|---|---|
| 0 | No correlation between x and y. |
| 1 | As x increases by 1, y increases by exactly 1. |
| -1 | As x increases by 1, y decreases by exactly 1. |
| negative | x and y move in opposing directions. As x increases, y decreases. |
| positive | x and y move in the same direction. As x increases, so does y. |
The size of the correlation coefficient indicates the strength of the linear relationship between x and y. The closer the coefficient is to 1 (either + or -), the more likely you'll find y given x. Below are some sample correlation graphs of various correlation coefficients:
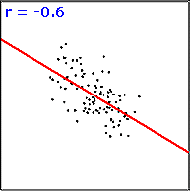
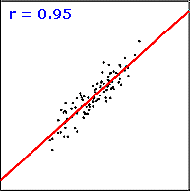
Note that with a higher coefficient
(0.95), the dispersion of data points are tighter around the line compared to a
lower coefficient of -0.6.
The correlation coefficient (r) can be expressed in the following mathematical form:
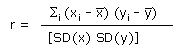
| xi, yi | x and y observations |
| x | the mean of x |
| y | the mean of y |
| SD (x) | Standard deviation of x |
| SD (y) | Standard deviation of y |
Memory Jogger
A correlation coefficient of 0.95 indicates that: