
Looking to Benchmark Pay?
Examples of Distributions
Q. Would you expect executive salaries to have a skewed distribution?
A. Yes, for example, the graph below might represent Controllers' salaries for companies with $100 million in revenue.
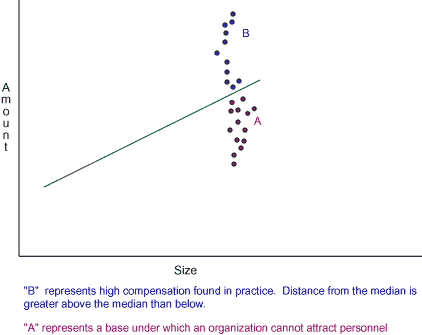
Frequency distributions
Given the following:
|
CEO SALARIES*
Organization Revenues ($100,000,000) |
||
| U.S. DOLLARS | MEN | WOMEN |
|---|---|---|
| $100,000 - $150,000 | 32 | 13 |
| $150,000 - $200,000 | 28 | 28 |
| $200,000 - $250,000 | 10 | 46 |
*The numbers used are for illustration purposes only.
Q. In what other frequency distributions might the above salary data be useful?
A. A human resources director might also be interested in frequency distributions by race or by age.
Practice question for frequency distributions
Draw a frequency table for the following data, using a range of 5 for classification.
28.3 |
7.2 |
12 |
12.5 |
14 |
9.6 |
30 |
32.5 |
28 |
22.9 |
28 |
16.7 |
28 |
20 |
24.2 |
Use the upper limit of the frequency class to determine which class to place each number in. For example, the number 4 would go into the frequency class of 0 - 4. However, the number 4.2 would go into the class of 4 - 8.
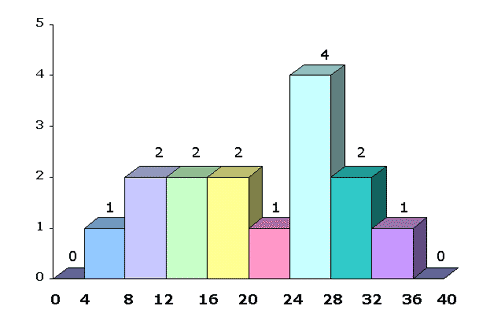
Frequency table for the data given in categories by increments of 4:
| FREQUENCY CLASSES COUNT | |
|---|---|
| 0 - 4 | 0 |
| 4 - 8 | 1 |
| 8 - 12 | 2 |
| 12 - 16 | 2 |
| 16 - 20 | 2 |
| 20 - 24 | 1 |
| 24 - 28 | 4 |
| 28 - 32 | 2 |
| 32 - 36 | 1 |
| 36 - 40 | 0 |
Corresponding frequency distribution - frequency class on the Y axis, data on the X axis.
Memory Jogger
Given the following, select the correct statement.
CEO SALARIES*
Organization Revenues: $100,000,000
| U.S. DOLLARS | CEOs |
|---|---|
| $300,000 - $450,000 | 20 |
| $450,000 - $600,000 | 14 |
| $600,000 - $750,000 | 9 |
*The numbers used are for illustration purposes only.