Comparing Salary Differentials between cities

Comparing Salaries in Different Cities Using Geographic Pay Differentials

Geographic salary differentials normalize salaries across various cities, regions, and locales based on the cost of labor. They enable one to evaluate a given salary, whether it be in San Francisco, New York City, or New Orleans. For example, an engineer living in St. Louis considers relocating to Atlanta, Los Angeles, or Nashville. How much would she have to earn in each of these cities to equate to her current salary of $95,000 in the Midwest, where the housing market and cost of living are considered affordable, based on her profession? How much would the employer in each of these cities consider as a reasonable salary offer to get her to move there and work for the organization?

How to Benchmark Geographic Wage Differentials in Competitive Markets

The employer is primarily concerned with market competitiveness. How much must the organization pay for competent labor in the current market? When and under what circumstances would it consider paying more than the market suggests? Does the company strategy include niche skills that are available through a very limited pool of candidates in a small industry or are there unlimited workers with readily available skills that translate across multiple industries? The candidate, on the other hand, will want to know about the cost of living in the cities being considered – how much money must she earn in order to afford housing, food, schools, transportation, and lifestyle. A move from the Midwest to San Francisco, where the housing market is extremely high, would require a considerable salary increase to maintain a standard of living realized in an area with a lower cost of living. The housing market in the south – New Orleans or Atlanta – might allow for a bigger house, even if the salary offered is lower. Typical salary and offer negotiations allow employers to consider offsetting the relocation expenses to ease the adjustment due to a higher cost of living. So, while an employer generally makes permanent decisions based on competition for labor, temporary cost-of-living allowances may be made for the employee to help with the relocation.

Geographic pay differentials are market-driven pay variations between geographic locations of the work performed. They are designed as a tool to create equitable compensation across labor markets, to the degree of verifiable differences in competitive salary levels across labor markets, most commonly using salary survey data. An organization’s compensation planning requires that it account for appropriate deviations in relevant labor markets, allowing for control of payroll/labor costs where it is not necessary to pay at higher levels, while ensuring adequate pay in areas where the market is much higher than the national average. Geographic salary differentials are often used to manage recruitment and retention difficulties, allowing organizations to attract and retain talent in premium markets, manage labor costs in non-premium markets, and facilitate perceptions of equitable pay.

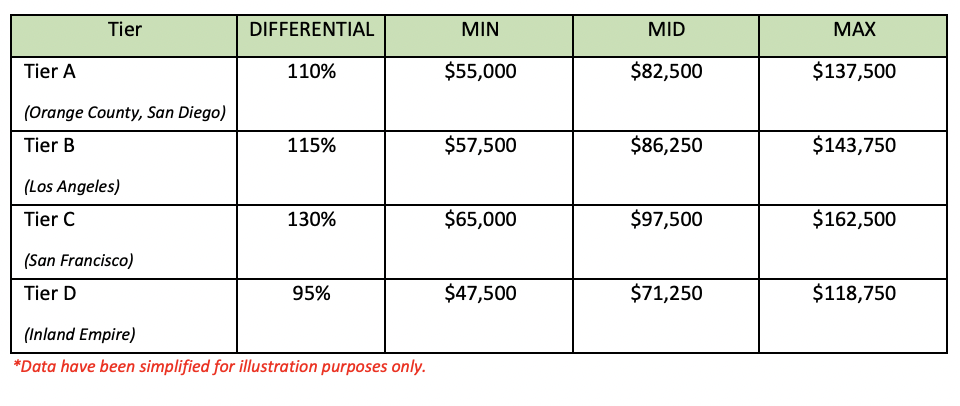
Where the role or incumbent is located has a significant impact on determining base pay levels. Even though consideration of multiple geographic areas may add complexity in pay management, base pay is driven by location since pay reflects the cost of labor of the local market. Geographic differentials may be applied for specific cities, or cities with similar differentials may be grouped into geographic tiers. While market pricing jobs by city is considered a best practice for assigning locations to geographic pay differentials, it is not always practical or possible to use market data by city. As an alternative, companies may create geographic pay differentials using a particular region or by grouping locations with similar market rates.

Organizations must consider alignment with the overall compensation philosophy and talent strategy. Local pay structures create a layer of complexity but, in general, ease administration and manager discretion. As employees move between locations, their salaries are adjusted to reflect ranges in the locations. To manage pay structures, companies need to determine how often they will review differential data to adjust ranges and pay inequities, annually at minimum. Additionally, they need to consider human resources information system (HRIS) implications for changing and maintaining multiple pay structures.

Wage Differential Example

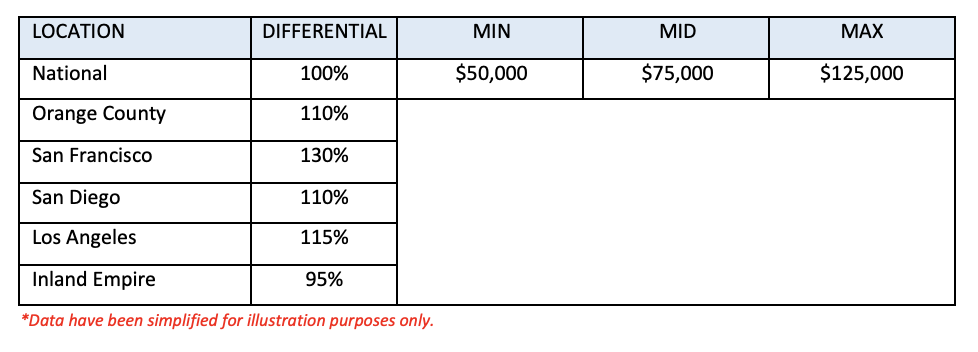
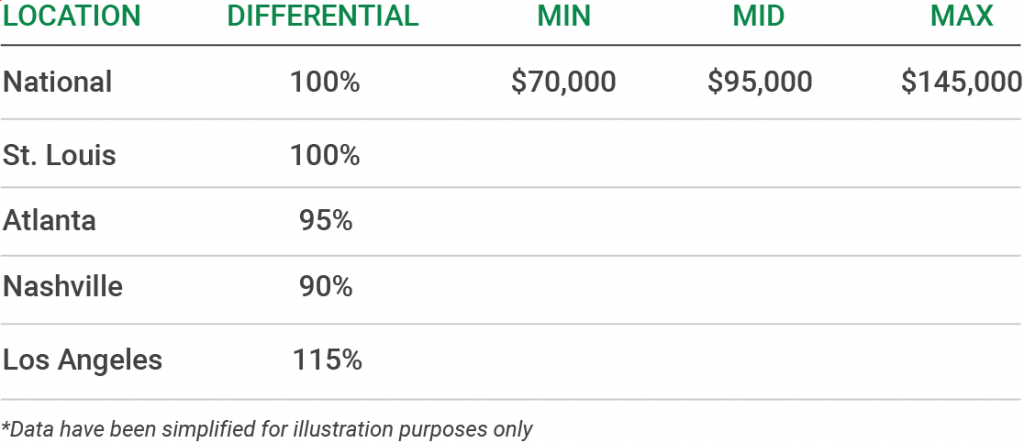
The engineering company mentioned above has its headquarters located in St. Louis with offices/branches in the cities indicated in the table below. The candidate considers relocating to one of the branch locations. Using salary survey data, the following observations have been made:

Comparing pay differentials between cities.

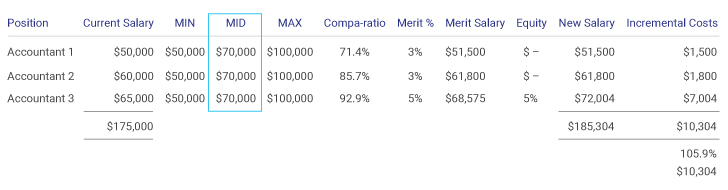
From the data, base salary can be established, based on differentials, and used to determine appropriate, fair, and equitable salaries for the candidate in each location, assuming 100% of the market value in terms of experience, skills, and knowledge:

Comparing pay differentials between cities.

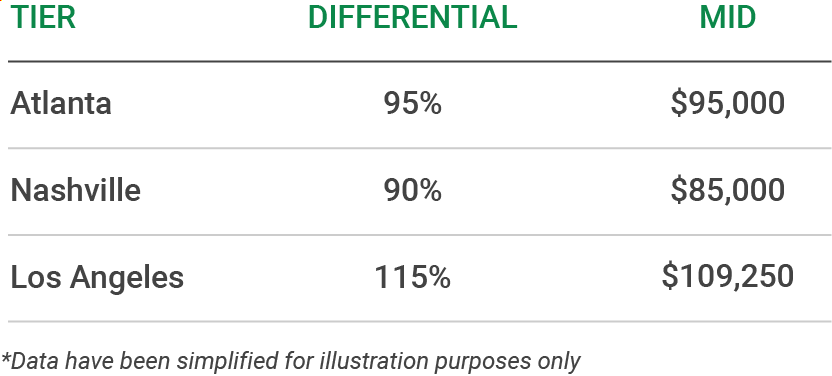
If labor supply is short in some areas, jobs will reflect that. The candidate is free to negotiate salary and offer package (e.g., bonus potential, relocation, etc.). There are no strict guidelines, so the organization may choose to continue the current salary even though a lower one is indicated (as in Atlanta and Nashville) but increase it for large cities with high costs of living (as in Los Angeles). The compensation strategy should reflect what the company wants to pay in relation to what the market and competitors for talent are paying for jobs in each location.

Work Remote

Hybrid Work from Home Models

The concept of remote work has been around for quite some time, according to an April 2019 article in Fast Company. “In the beginning (of work), there was no such thing as going to a different place to labor.” Work and home combined, giving space for spinning and weaving, dairy and butchering, watchmaking, funeral parlors, and schools, with proprietors living and working in the same building. IBM experimented with technology by installing “remote computer terminals” in employees’ homes. The program was successful, resulting in 40% of IBM employees successfully working from home by 2009, allowing a reduction in office space and an annual savings of over $100 million.

Much pre-pandemic opposition to remote work came down to the perception that employees require constant supervision to maintain productivity. Left to their own devises, employees would abuse the trust and indulge in non-productive personal activities, including housework and personal errands. However, an article listed one of the possible benefits of remote work as ensuring an organization is “better prepared to continue operating in the event of a disaster.” Ten years later, enter COVID-19, and working from home became the new normal. With the onset of the pandemic, emergency government directives closed non-essential businesses and instructed non-essential workers to stay home. Faced with this reality, businesses sent workers home with the necessary equipment and software to work remotely, allowing many businesses to survive.

Work from Home Surges due to COVID-19

Now, almost two years later, companies are grappling with how and if to bring employees back to the office – the physical building. While remote work may be impractical at some organizations, the remote work experience seems to have worked on a large scale. Employees faced with childcare issues as schools shut down managed to juggle online school and their own job responsibilities. Some even moved to other less expensive locales. Schedule and location flexibility are two highly prized perquisites that often lead to “an easier time retracting and retaining talent.” According to an October 2016 Workplace Insight article, those working from home were more likely to work longer hours with fewer sick days, resulting in greater productivity overall.

Now, with vaccines and a slow return to in-person activities, the workforce is not eager to give up remote work. Many workers are choosing to focus on jobs that allows the flexibility to define their lives on their terms. Many employees who started working remotely due to COVID-19 overwhelmingly support it and want to continue doing so. Organizations can no longer reasonably say that they cannot operate remotely. However, the ongoing global pandemic (with variants, vaccine requirements, and mask mandates) may make the requirement that some employees return to the office full time futile. One popular solution to this problem is the hybrid remote work model.

What Is the Hybrid Remote Work Model?

The hybrid remote work model effectively combines in-office and remote work. There is no hybrid model that fits all organizations. Rather, each organization develops a unique hybrid model depending on its business needs and organizational structure, as well as the needs of the individual employee (to an extent). Hybrid remote work models may look different in every organization, but there are a few clear themes.

Remote-First

Depending on the job, working remotely is now the norm for most employees, rather than something allowed only in certain circumstances. Few, if any, people are regularly required to perform their jobs from a centralized office. Remote-first companies may operate a physical workplace of some kind, which is available to employees who need or prefer a traditional office space outside of the home. However, the majority of people on a remote team work most often from home or another location outside of the corporate office. This model treats remote work as a default, the equivalent of office-based work. Organizations now intentionally build remote work into every aspect of their business; it is not an afterthought designed to modernize the company image, reward employees, or serve as a benefit. It is no longer an experiment.

The following is a list of just a few remote-first companies:

Companies That Are Remote First

Office-Occasional

An office presence is required in this hybrid remote work model. Employees spend a set number of days in the office (e.g., Tuesdays, Wednesdays, and Thursdays) and a set schedule working remotely (e.g., Mondays and Fridays), maintaining office or cubicle space with essential office equipment. They also maintain a remote office space, often using a laptop, which allows for portability. Technology supports regular communication, such as email, cell phones, Zoom, and collaborative software like Microsoft Office Teams. An employee’s laptop travels back to the centralized office for work on site and is set up via a docking station for network access in the remote office. Dual-factor verification can be used to maintain digital security. Leaders may want their teams in the office on the same days to maximize collaboration and spontaneous discussions.

Office-First, Remote Allowed

This hybrid remote work model offers the occasional opportunity to work remotely – perhaps to work on a project that requires quiet concentration and few interruptions – but employees have a physical office space (or cubicle) where most of the work gets done. Remote work might be seen as a privilege, or a perk, and be available only to a few select employees, with the company culture still based on work in the physical office.

Make the Hybrid Remote Work Model Work for Your Company

There is no one-size-fits-all hybrid remote work model. Organizations, with some employee consideration, must develop the solutions that work for them. Employees have proved for more than an entire year that they can and will perform demanding work outside of the physical office. Organizations need to shift culture to encourage quality connections and communication, creating opportunities for fostering genuine relationships. Leaders must work diligently to determine the new norms required to get the collaborative benefits of any hybrid remote work model while maintaining the flexibility that employees now enjoy. When health conditions allow for a complete return to work, regardless of how many employees are in a space, the labor market may force companies to consider that most workers want to remain at least partially remote, with many ready to quit or change jobs if forced back full time. The fact remains that there are some jobs that cannot be performed from home. But, for many jobs, organizations must carefully adapt their processes and systems to support hybrid remote work. This does not suggest that hybrid work cannot be effective when it is carefully considered. It will likely take a while to figure out how to navigate the hurdles surrounding hybrid work, and success will depend on having sound policies and processes, clear and consistent communication, and a strong sense of structure and equity.

Customer paying for coffee at cashier

How to Retain Minimum Wage Employees

Minimum wage jobs include such occupations as cooks, fast food workers, hosts, hospitality workers, dishwashers, cashiers, childcare workers, waiters, bartenders, and retail workers. Low wages and few, if any, benefits are typical. But with the pandemic, many workers have concluded that those conditions are no longer acceptable. A Georgetown University article reports, “The pandemic shook up what workers want and expect from a job. America cheered frontline workers during the early days of the pandemics…But these workers’ wages remain too low to cover rising housing, education, and health care costs.”

Organizations can make a positive impact on retaining minimum wage employees by developing focused plans to address typical issues that lead to turnover. Offering fair compensation is vital, and organizations must remain within their financial budgetary boundaries; however, addressing non-monetary issues is another key component.

Employee Engagement and Recognition

Gallup research indicates that having a “bad” manager compounds employee stress and impacts their well-being, affecting both home life and work. Managers can have a significant impact on employee engagement, with engagement defined as, “the emotional commitment, enthusiasm, and dedication the employee has to the organization and its goals” (see this Forbes article for further discussion). Employees who feel as though their managers are invested in them as people are more likely to be engaged and less likely to look for opportunities elsewhere. The best managers make a concerted effort to get to know their employees and help them feel comfortable talking about any subject, whether it is related to work or not. They motivate and build genuine relationships, which encourages a productive workplace where employees feel safe enough to face challenges, to share information and new ideas, and to support each another.

Most, if not everyone, enjoys recognition for a job well done. Some prefer quiet, low-key recognition, while others want to be celebrated front and center. Appreciation is an effective means of honoring the hard work and efforts of teams and individuals. Small non-monetary gifts can be quite effective, as are small bonuses or gift certificates.

Development and Benefits

The desire to learn and grow is a basic employee need. Many minimum wage employees are students, working to advance to better paying jobs by continuing their education. Others are interested in working their way up to management or technical careers. Companies that offer mentoring, formal coaching, development opportunities, or tuition reimbursement demonstrate a willingness to invest in the employee as a person, encouraging loyalty and positive branding of the organization. Leaders should continually invest in learning and development opportunities for all employees.

Many minimum wage employees are interested in individual and family benefits, such as health care, dental, vision, and life insurance. Often minimum wage positions do not offer any such benefits. If a company can find the sweet spot to offer these to employees at a reasonable cost-sharing level, this is another way to foster loyalty and retention, beyond wages.

Onboarding

Developing an effective onboarding plan – first impressions – is a crucial step in retaining employees. Taking the time to acclimate employees to the company culture and ensuring they know where to find simple things, such as the breakroom and supplies, can eliminate needless frustration and help new employees experience a sense of productivity quickly. Orienting them to the history of the organization, the leaders, strategy, and goals tells employees what is expected of them and that they are part of something bigger than themselves.

Wages

The federal hourly minimum wage is $7.25; California is $14. Addressing a living wage in the time of COVID-19 is tantamount to getting low wage employees back to work. Some are vaccine avoidant, while the fear of contracting the virus (and its variants) is an ongoing issue among others, creating a complex environment to attract and retain low wage workers. Many companies are getting creative with wages, recognizing that a monetary boost may be the only way to entice typically low wage employees back to work. Amazon recently reported increasing the starting hourly pay rate to $18 to hire over 100,000 employers to support the increase in business. Some Amazon locations are increasing the rate to $22.50 and offering health, vision, and dental insurance, 401(k) plans, up to 20 weeks of paid parental leave, and college tuition reimbursement. The company is one of many increasing average wages in a bid to entice workers, with many retailers forecasting a busy holiday season ahead, which will be hard to navigate with the current labor shortage. Other industries, such as restaurants, are experimenting with paying the full minimum wage instead of the minimum for tipped employees plus tips, adding a 20% service charge to every check, and sharing the tips with entire staff, including those who do not typically share in the pot. For more information on benchmarking wages and help with determining pay rates, visit ERI’s blog post about compensation planning.

Positive Work Environment

Fostering a positive work environment is a simple non-monetary strategy that all organizations can create. Turnover may be inevitable in some jobs, but showing appreciation, celebrating, having fun, coaching, and mentoring, showing care and concern, and getting to know employees leaves a lasting positive impression that goes beyond money, fostering job satisfaction, productivity, and motivation.

Salary Increase vs. Cost of Replacement

When a company needs to “tighten its belt” for any reason (e.g., COVID impacts, financial losses, rising labor costs, etc.), one of the first things to suffer is the merit increase budget.  Many companies declared a moratorium on increases last year, just to get through the economic uncertainties posed by the pandemic.  It is very easy for employees’ salaries to fall behind because of an off year.  One year without a meaningful increase can have compounding effects on those who remain loyal to a company.

So, picture this scenario. Company employees did not receive a merit increase one year due to economic reasons.  But hiring new employees requires a salary reflective of the current market.  The salary required to hire a new candidate is $80,000 in a particular job, but current employees with proven performance are earning, on average, $75,000.  If a merit increase of 3%, or even up to 6%, is granted for the current year, then those employees are still earning less than the newly hired employee.  Despite proven performance and organizational contributions, their earning potential has decreased.  This happens all too often and can have a discouraging effect on the company’s existing workforce.

What Can HR Do to Help Retain Employees?

Asking employees to remain loyal to the company and ride out the economic waves, to do more with fewer people, and to take on more responsibilities − all without necessarily compensating them − is the norm. Consequently, employees often start to search for external opportunities that will reward them competitively.  Business Insider reports that “job openings exceeded available workers…for the first time since the pandemic recession began” and that “businesses have raised wages at the fastest pace in decades to attract workers amid the shortage.”  An August 2021 SHRM article reports, “The BLS report comes amid employers reporting that difficulty finding workers to fill open jobs continues to hold back hiring. Evidence shows that many employers are increasingly desperate to hire, offering higher pay, signing bonuses and more flexible working hours to attract applicants, a shift in power that has given job seekers the upper hand.” 

In general, if compensation is fair in comparison to the employee’s contributions, then individuals will remain with an organization.  However, the stronger, worker-centric hiring climate today means employees who do not feel well compensated may be more willing to look for a better-paying job.  High performers who contribute significantly to the success of the organization’s mission and strategic goals, with essential critical skills and qualifications and perhaps in difficult-to-recruit positions, are worthy of proactive review. Employees leave organizations for many reasons. While many factors contribute to turnover, competitive pay can be the difference when it comes to retaining skilled talent.

Armed with the leverage of an external offer, quite often, the employer’s response is to offer a retention bonus to match it.  But what message does it send to the employee and to the entire organization? The message is that the company is not willing to pay your worth unless there is a chance that they will lose you and need to go through the expense and process of recruiting.  This can have a negative impact on engagement, contributing to low morale issues, greater absenteeism, and loss of productivity not only to the employee (who may be distracted looking for meaningful compensation elsewhere), but to the entire team.

Organizations would do well to engage employees in conversations about retention, or “stay interviews,” to gain an understanding of the factors affecting why employees stay and why they leave. While not all positions are considered critical and, not all turnover is regrettable, the costs in time, money, and productivity associated with external recruitment are significant.  Considering the cost of replacement of employees is crucial to an overall business strategy, but with an effective retention policy, employers can minimize employee turnover.

Cost is one of the biggest challenges of hiring new talent. SHRM estimates that “the cost of directly replacing an employee can run as high as 50 to 60 percent of their annual salary, and total associated costs of turnover can rise to 90 to 200 percent.” Considering the costs of hiring a replacement, orientation, and training compared to investing in proactive retention strategies that include base salary increases, it would be wise for organizations to make provisions in their budget proactively. Salary benchmarking can save hours of headache and can help reduce employee turnover.

Total rewards define an organization’s strategy to attract, motivate, retain, and engage employees, resulting in satisfied, engaged, and productive employees who, in turn, create desired business performance and results. Increasing base salary, matching an external offer, or giving a retention bonus are not the only ways to keep employees.  Offering opportunities to grow and develop, as well as flexibility for work/life balance, are all important.  For more information about finding the true cost of retaining vs. finding a replacement, as well as methods for how you can prevent employees from leaving, visit ERI’s blog, which covers a range of topics related to HR and compensation.

How to Use Compa Ratios to Guide Compensation Decisions

When evaluating how competitive and equitable pay is within your organization, a very familiar pay metric can be used to identify potential trouble spots: compa ratios.  A compa ratio compares an individual employee’s salary to the midpoint of a given salary range. This simple metric can be utilized in many ways to guide compensation decisions when used thoughtfully and consistently.

Using Compa Ratios to Help Calculate Salaries and Make Business Decisions

As discussed in Merit Matrices: What Are the Compa Ratio and Market Index?, “compa ratio is the relationship of base pay to the salary grade midpoint and is expressed as a percentage.” It is calculated by dividing the actual salary by the midpoint of the corresponding salary range.

For example:  If an Accountant earns an annual salary of $80,000, and the salary midpoint for the position is $80,000, then the compa ratio is 1.0 or 100% expressed as a percentage ($80,000/$80,000).  This reveals that the employee is paid at the range midpoint; values higher or lower indicate how salaries compare relative to midpoint.

The compa ratio can reveal many things about how the employee is paid.  If the salary range midpoint aligns with market data at the 50th percentile, then it means that the employee is paid at the same rate as others in the relative market.  This assumes that an individual with the same level (years) of experience, skills, knowledge, and education can expect a salary at the same rate.  Someone with less can expect to be paid lower in the range (with a lower compa ratio that is less than 100%) and a seasoned professional would most likely be paid at the higher end of the range (with a higher compa ratio that exceeds 100%). 

Establishing Pay Rates

This is useful information when determining candidate job offers.  A compa ratio of 100% indicates that the salary in question is paid at the market rate that one can expect to pay for fully competent, experienced incumbents.  A compa ratio less than market is appropriate for incumbents still learning, with relatively few years of experience (perhaps a new college grad), or those new in the role.  A compa ratio greater than 100% is usually reserved for those who are highly experienced, have been in the role for several years, or perhaps have some niche skillset. Salary adjustments can be made to the salaries of existing incumbents as information is gathered about the salary needs of current candidates.

Annual Compensation Review

Compa ratio formulas and calculations can be used to get a bird’s-eye view of where positions fall in relation to the external market.  This will show where salaries align to the market, to internal salary structure, and to others in the position.  This data may reveal a need to adjust the ranges. Once the pay inequities and salary adjustments have been identified, pay adjustments can be calculated.

Performance-Based Merit Increases

Many companies use a compa ratio performance matrix, or a merit matrix, to determine increases based on performance and market comparisons.  An employee’s progression through the pay range may be directly related to performance. A merit matrix provides guidance on how to match performance ratings to compa ratios when determining merit pay increases. A merit matrix is a two-factored table that considers performance rating and some measure of relative salary placement, typically compa ratio.  It is designed to provide a framework to help managers equitably navigate the allocation of merit increases across their employee population and should be structured to fairly reward high-performing employees similarly across the company to reduce the risk of salary-increase inequality. Since pay increases are most frequently made as a percent of salary, that would mean that high-performing employees receive the same percent increases across the organization, independent of the position.

Compa ratio is a common statistical compensation tool, though it is not meant to be taken at face value in every situation.  ERI’s Salary Assessor utilizes compa ratios to help calculate and benchmark salaries. An investment of time to know the company’s pay structure, its jobs and niche talent market, as well as the compensation strategy allow the use of this tool to begin a conversation about the meaning of the results.  A low compa ratio in a company that pays higher than most for a group of jobs is not necessarily a bad thing to be remedied immediately.  Many companies with union-represented positions have pay ranges that reflect the negotiated pay ranges, which may be higher than the broader market. It is important to use the tools consistently that work best for supporting the overall company strategy.

merit-matrix

Merit Matrices: What Are the Compa Ratio and Market Index?

A merit matrix is a mathematical grid that compensation professionals provide as a management tool to support efficient and consistent administration of salary increases to employees. A merit matrix is a two-factored table that considers performance rating and some measure of relative salary placement, typically compa ratio.  It is designed to provide a framework to help managers equitably navigate the allocation of merit increases across their employee population.  A merit matrix should be structured to fairly reward high-performing employees similarly across the company to reduce the risk of salary-increase inequality. Since pay increases are most frequently made as a percent of salary, this may result in high-performing employees receiving the same percent increases across the organization, independent of the position.

What Is the Compa Ratio?  How Does It Relate to Salary Benchmarking?

Compa ratio is the relationship of base pay to the salary grade midpoint and is expressed as a percentage. It is calculated by dividing the actual salary by the midpoint of the corresponding salary range.

For example:  If an engineer earns an annual salary of $162,000, and the salary midpoint for the position is $165,000, then the compa ratio is 98.18% ($162,000/$165,000).

From this comparison, it is concluded that the engineer’s salary represents approximately 98% of the range midpoint.  But what exactly does the midpoint represent?  The midpoint of the salary range represents market value, as defined by the compensation philosophy. Some companies pay at market median or the 50th percentile, or maybe the 75th percentile for senior management level jobs.  It all depends on the company’s pay philosophy and compensation strategy. Salary ranges and midpoints must be reviewed periodically to make certain they remain connected to market value.  Periodic checks on the grading structure are important when using this comparison. 

All of this is important in being able to make a simple comparison across employees in different ranges.  When reviewing salaries, a compa ratio in one title may represent different salaries but the same percentage, which can then be evaluated evenly.  So, a compa ratio of 80% may be considered low, but in terms of absolute dollar value, the highest paid may be comparatively less well paid than others on the team.  All could have the same compa ratio while earning vastly different salaries.  Compa ratio should be used to determine where employees are in relation to midpoint and their performance.  The simplified merit matrix below illustrates the range of increases available for distribution of the increases:

What Is the Market Index?  

In contrast to the compa ratio, which compares base salary to internal structures, the market index compares base salary to the external marketplace. Market index is a ratio that compares salaries to the market average for those positions, assuming that the jobs are appropriately benchmarked and market priced.  Using market index as a comparator to the target position of the company (median, mean, 50th percentile, etc.) may be a better indicator of whether some job families need an adjustment or not.  For example, if the average market index within a grade is 110%, then those employees would be 10% above market. This might be desired if an organization is targeting a market position 10% above market, and the market index allows for measurement of that target.

These statistical tools are just that – tools.  They are not meant to be taken at face value in every situation.  A low compa ratio in a company that pays higher than most is not necessarily a bad thing to be remedied immediately.  Each requires an investment of time to know the company’s jobs, talent, compensation challenges, what’s working and what isn’t, and where the gaps in salary equity are.  Use the tools that work best for accomplishing the strategic goals of the organization.  For more information on how to properly benchmark pay for different jobs by experience, location, and more, see ERI’s blog, which covers topics ranging from total compensation benchmarking to geographic salary differentials.

How To Use Compensation Budgeting to Calculate Raises

The compensation philosophy defines how employees are paid, how work is valued, and how the company’s financial resources – the budget – are allocated.  The compensation strategy supports this philosophy, defining market competitiveness and position.  Based on the compensation philosophy, Finance and Human Resources, along with department leaders and managers, develop an annual payroll budget designed to successfully execute that philosophy and ensure a labor force to support the company’s goals.  Effective compensation budgeting requires careful planning and consideration of factors, both internal and external, that impact the labor force. It is one of the most important functions of Finance and Human Resources. 

An annual salary review of all jobs, using salary survey data, allows for planning and preparation to make timely financial decisions to keep the labor force competitive.  This activity should align with budget preparations. HR professionals utilize salary survey data to conduct salary reviews in order to calculate salary increase percentages and plan future compensation.

The salary review should reveal the following:

  • Equity considerations

External – Which salaries are falling behind the pace of the market?  Are there hot jobs for which you need to keep pace more aggressively?  Is there a trend in turnover rates for certain positions?  Where are you losing jobs?

Internal – Identify fair pay issues or adverse impact based on protected categories (i.e., race, gender, ethnicity).  Are there compression issues between supervisors and managers and their direct reports?  Are there long-term employees being paid less than new hires?

  • Position in range or compa-ratio

Use statistical formulas to get a bird’s-eye view of where positions fall in relation to the external market by using compa-ratio and position-in-range calculations.  This will show where salaries align to the market, to the internal salary structure, and to others in the position.  This data may reveal a need to adjust the ranges.

Use range penetration if the structure includes broad or wide bands/ranges.  Go deeper in the range for those with significant experience who are performing well.  If range structures are broad, compare market position in range to current/actual position in range.

Does the range midpoint reflect the 50th percentile of market?  If so, use compa-ratio to determine if an adjustment is needed.  If the compa-ratio is less than 80%, consider moving the salary.  Is the incumbent new in the role, with less experience (e.g., less than three years of experience), and still learning the role?  In that case, expect to see the incumbent paid at the 25th percentile or somewhere below the market 50th percentile.  With three to five years of experience, expect the incumbent to be a competent performer who is fully performing and contributing.

  • Structures – If the ranges are increased, bring those below minimum to the new range minimum.
  • Any legal or contractual obligations to consider, such as minimum wage updates or labor union contracts?

After the initial salary review, discuss the findings with managers and department leaders.  In addition, solicit input regarding promotions, performance, and development of high potential employees.  Ask managers to consider where they see their staff over the next year.  Do they have key employees who are flight risks?  Are there opportunities to develop an employee for possible succession planning?  Has HR identified any fair pay, equity, or compression issues that need to be addressed?

Armed with a comprehensive list of salary adjustments needed, as well as anecdotal data from managers regarding impending promotions and performance, HR can calculate the costs associated with pay raises, salary adjustments, and promotions for inclusion in the salary budget. Calculate and communicate compensation budget needs.  Summarize the budget requests, then present and submit compensation budget requests to the Finance team.

Calculating Pay Raises

Once the pay inequities and salary adjustments have been identified, the next step is to calculate pay raises. Many companies use a merit matrix to determine increases based on performance and market comparisons.  Compa-ratio compares current salary to the market position of the range midpoint (usually 50th percentile).  A compa-ratio of 100% indicates that the salary in question is paid at the market rate that one can expect to pay for fully competent, experienced incumbents.  A compa-ratio less than market is appropriate for incumbents still learning, those with relatively few years of experience (perhaps a new college grad), or a new incumbent in the role.  A compa-ratio greater than 100% is usually reserved for those employees who are highly experienced, have been in the role for several years, or possess some niche skillset.  Determine which ratios need attention, keeping the compensation philosophy in mind.  If a ratio is less than 80%, those positions may need an adjustment to align with the competitive market.  Calculate the amount needed to bring the salary to the range midpoint, if appropriate.  An interim approach would be to gradually adjust, bringing the ratio up in increments.

For example:

Accountant 1 is paid $50,000 as a new college grad with no experience.

Accountant 2 is paid $60,000 with 2 years of experience and competent performance.

Accountant 3 earns $65,000 with 7 years of experience and is considered a high potential employee.

Market for the position is $70,000, and the range is $50,000 – $100,000.

The compa-ratio calculation for Accountant 1 is current salary/range midpoint or $50,000/$70,000.

The ratio is 71.4%.  At first glance, the ratio may seem rather low.  However, given that the incumbent is a new college graduate with no experience who is not fully competent in the role, the ratio is acceptable.  Competent performance earns an additional 3% of salary ($1,500) with a new salary of $51,500 and a new compa-ratio of 73.6%.  

The compa-ratio for Accountant is 85.7% after 2 years of experience, assuming the incumbent is demonstrating competent performance.  With additional experience and continued performance, the incumbent should reach market within a year. Competent performance earns an additional 3% of salary ($1,800) with a new salary of $61,800 and a corresponding compa-ratio of 88.3%.

Accountant 3 has 7 years of experience and is considered a high potential employee, ready for more responsibility and promotion.  Outstanding performance earns a 5% merit increase ($3,575) and a compa-ratio of 98%.  A 5% equity adjustment is suggested to move the incumbent further in the range, in recognition of experience and performance, positioning to maintain a sense of competitiveness with other organizations.  The cost of the equity adjustment is $3,429, with a final salary of $72,004 and a 102.9% compa-ratio.

The total cost for the suggested salary action is $10,304, or 5.9% of current total salaries. 

It is important to follow the established review and approval process, making certain to adhere to budget guidelines. (Finance may build in some margin.)  Load decisions into the Excel workbook or compensation management system to get the results.  Continue to develop solutions for needed salary adjustments. Calculate the costs and compare to the allocated budget.  Finance will be interested in the roll-up or overall budget impact.  Cost out the scenarios identified to fix any issues and determine what you can afford to pay; that is, fix everything at once, fix issues over a period of time, fix critical positions, or make changes to your strategy, philosophy, or policy.  Utilize ERI’s Salary Assessor to help plan and calculate raises and plan future compensation budgets.

Finance, in conjunction with HR, is responsible for determining the overall payroll budget dollars to present to leadership, who may approve the budget request as is or possibly ask for adjustments by a certain percentage to maintain a certain level of expense (say 3% of payroll).

Once finalized and approved, send the plan to department leaders to distribute based on overall guidelines provided to ensure equity and a sense of fairness.

What Is the Difference between Median and Mean Salary?

Median literally means “the middle.” It refers to the middle value of a series of values arranged in numerical order, from smallest to largest. There is an equal probability of a value falling above or below it.  If there is an even number of values, then the median is calculated by averaging the two middle values. 

Half of the salaries fall below the median and half are greater than the median value. 

  • The median salary of the series $55,000, $162,000, $176,000, $185,000, $193,000, and $200,000 is calculated by adding $176,000 and $185,000, then dividing by 2 to get the average of the two middle values.  In this case, the median salary is $180,500.

Again, half of the salaries fall below the median and half exceed the median value. 

The term mean refers to the average value of a dataset; specifically, the sum of the values divided by the number of values.  Using the data above, the average salary in the first example is:

  • ($55,000 + $162,000 + $176,000 + $185,000 + $193,000) / 5 = $154,200

In the second example, the average salary is:

  • ($55,000 + $162,000  + $176,000 + $185,000 + $193,000 + 200,000) / 6 = $161,833

When to Use Median Salary vs. Mean Salary for Compensation Benchmarking 

Depending on the nature of the data, either the mean or the median may be more useful for describing the center of the dataset.   Both estimate the location of the center of the dataset.  They may seem similar, but significant variations can occur when comparing the median salary with the mean salary.

The difference comes in when there are outliers in the data. A few people earning a much higher salary than normal can skew the results to make it look like it is normal to earn more. This is important in determining where most employees’ salaries are expected to fall, given the same or similar skillset, years of experience, education, and knowledge.  It can help determine or validate the salary midpoint and range, as well as setting salaries for new hires, offering promotions, and evaluating the salaries of current incumbents. 

The mean can be misleading if there are outliers in the data set.  In the first (very simplified) example referenced above, the median salary of the dataset provided is $176,000, while the mean salary is $154,200.  The relatively low salary of $55,000 is much lower than the other salaries in the series.  This salary may be explained by entry-level employees with minimum qualifications and little to no experience as compared to employees with many years of experience and proven performance, knowledge, skills, and abilities.  Using the median value versus the mean results in a $20,000 difference in salary.

Advantages of Using Median Salary

In general, the median is a better indicator than the mean for measuring typical values. It is not significantly changed by outliers. When a distribution is skewed, the median does a better job of describing the center of the distribution than the mean. It is best to use the median when the distribution is either skewed (i.e.,  there is a higher number of values at the top or bottom of the distribution) or there are outliers present.

The mean, however, is very sensitive to the most atypical values, especially very high or very low values.  If there are no outliers in the dataset, then the mean can be used since the distribution would be fairly symmetrical (a bell curve distribution).  It is best to use the mean when the distribution of the data values is symmetrical and there are no clear outliers.

For six employees with a range of salaries of $16,500, $18,000, $18,000, $20,000, $21,000, and $45,000, the mean salary is $23,083.  This salary is actually higher than five of the employees, but still much less than the highest earner.  The median salary is not as likely as the mean salary to be skewed by outliers (e.g., an extremely high or low salary that only a few people may earn).  It may not seem like much, but it can give an inaccurate view of how much most people make in the field.

When considering a larger set of numbers or industries where there are a few people who are paid extremely well, the median can give an even more inaccurate view of the typical salary. This can also occur with a few extremely low-paid outliers, which would result in a lower mean salary. Using the median approach eliminates the skewing that can happen due to the extreme salaries in the data. The median salary in the example above is $19,000, which is more in line with what the majority earns. 

This is critical information when reviewing the salaries of incumbents for job offers, especially where limited or no market data are available.  The median salary is considered more neutral than the mean salary.  A mean salary that is much higher than the median indicates salary outliers, where some employees earn much more than the overall group of employees.

Both mean and median salary calculations are useful and should be reviewed beyond the simple, straightforward mathematical equations to determine the best use of each in any given situation.  As with all compensation, it is a balance between “art” and “science” and requires a bit of detective work to investigate which is most relevant and meaningful.  Learn more about how to accurately compare mean versus median in terms of salary compensation and how mean and median salaries affect benchmarking for total compensation at ERI.

Geographic Pay Differentials: Practices in Managing Pay Between Locations

For companies operating in different states, an effective compensation planning strategy includes a comparison of relevant labor markets for pay differentials based on geographic locations of the work. Geographic differentials are market-driven pay variations between locations. One of the most important overall planning strategies is to create equitable compensation across labor markets for the entire workforce. There could be far-reaching budget implications if compensation planning does not account for the appropriate deviations in relevant labor markets. The objective is to control costs where it is not necessary to pay at higher levels or to ensure adequate pay in areas where the market is much higher than the national average.  Creating and adopting the use of geographic pay differentials may be needed to recognize recruitment and retention difficulties.

The standard for decisions about implementing geographic pay differentials is the degree to which there are verifiable differences in competitive salary levels across labor markets.  The location of the role or incumbent has an impact on determining base pay levels.  Geographic differentials enable organizations to attract and retain talent in premium markets, manage labor costs in non-premium markets, and facilitate perceptions of equitable pay.  However, it may add complexity in pay management if there are multiple geographic locations involved.

How to Calculate Geographic Pay Differentials

Base pay is driven by location as pay reflects the cost of labor of the local market. Geographic differentials may be applied for specific cities, or cities with similar differentials may be grouped into geographic tiers.  While market pricing jobs by city is considered a best practice for assigning locations to geographic pay differentials, it is not always practical or possible to use market data by city.  As an alternative, companies create geographic pay differentials using a particular region or by grouping locations with similar market rates. 

Organizations need to consider whether or not this approach aligns with the overall compensation philosophy and talent strategy.  Local pay structures create a layer of complexity but, in general, ease administration and manager discretion. As employees move between locations, their pay rates are adjusted to reflect their new location’s range.  To manage pay structures, companies will need to determine how often they will review differential data to adjust ranges and pay inequities, annually at minimum. In addition, they will need to consider HRIS implications for changing and maintaining multiple pay structures.

Example:

The company has its headquarters located in Orange County with offices/branches in the cities indicated in the table below.  Each office posts a position for an Accountant. Using salary survey data and geographic locators, the following observations have been made:

From the data, separate base salary structures are created by grouping together similar markets based on differentials.  This is then used to determine appropriate, fair, and equitable salaries for candidates in each location.

If the labor supply is short in some areas, jobs will reflect that.  As noted earlier, regular review of the salary structures and jobs is necessary to maintain competitive wage ranges when the workforce is spread across cities, states, or the country.  The compensation strategy should reflect where the company wants to pay in relation to what the market (and the competition for talent) is paying for jobs in each location. The illustration provided is based on creating structures for jobs that are recruited in the local area.  Higher level jobs (i.e., executives, directors, and senior managers) typically are sourced nationally and require consideration of other factors, such as industry, annual revenue, and number of employees.  These factors will vary by job.

ERI’s Geographic Assessor makes it easy to calculate the geographic cost of labor differentials. Use the geographic wage differential data to set branch office salary structures, calculate adjustments for cost of living differences, and more. Visit ERI to learn more about how to design geographic salary differentials and how to properly set pay in different locations. 

What Are Pay Differentials and How Should I Use Them?

What Are Pay Differentials?

Pay differentials are conditions for which an employer is willing to compensate an employee with additional wages.  Much depends on the company’s compensation philosophy, history, and pay practices.  Pay differentials can often be an important aspect of getting compensation right because they can help entice employees to take certain less desirable assignments, such as evening, night, or weekend shifts, on-call or call-back pay, or hazard pay, or recognize employees with specialty/certification pay. For companies operating in different states, an effective compensation planning strategy should include comparison of relevant labor markets, which may vary widely, for pay differentials based on the geographic locations of the labor force.  One of the most important overall planning strategies is to create equitable compensation across labor markets for the entire workforce. 

How Are Pay Differentials Used in Compensation Planning Strategies?

There are different methods for determining geographic pay differentials, with two of the most popular being differentials by job and differentials by structure.  This blog is focused on the former method, using a tool such as ERI’s Salary Assessor.  Look for a discussion of the latter method, using a tool such as ERI’s Geographic Assessor, and a comparison of the two approaches in future blogs.

Companies should consult salary survey data to determine the variation of pay across the relevant states and locales where they operate. Salaries across the United States can fluctuate significantly based on where jobs are located. Most commonly, employers leverage salary differential data when budgeting for large, multi-location hiring efforts. However, an organization hiring for the same job in multiple labor markets might know what salaries to pay employees at their current location but not necessarily the pay differentials in unfamiliar markets.

There could be far-reaching budget implications if compensation planning does not account for the appropriate deviations in relevant labor markets.  For example, the labor market for an Administrative Assistant may be lower in Orange County than in Los Angeles across industries; however, with the shortage of Clinical Laboratory Scientists, Orange County must now compete with the Los Angeles labor pool. This increased competition requires the organization to pay much higher salaries than once was the case. Geographic differentials are market-driven pay variations between locations.  Companies use these differences when pricing the same job in different geographic markets. 

The objective is to control costs where it is not necessary to pay at higher levels, or to ensure adequate pay in areas where the market is much higher than the national average.  It is an adjustment based on the cost of labor, not the cost of living.  Creating and adopting the use of pay differentials may be needed to recognize recruitment and retention difficulties, as well as special professional or educational certifications creating hot jobs.  In addition, geographic differentials can make it easier to conduct internal equity reviews or discrimination analyses.

Companies should perform a comprehensive job-by-job market analysis regularly to effectively implement pay differentials.  As with all compensation, pay differentials should be applied consistently and fairly, adhering to federal and local regulations.  Establishing written policies and procedures outlining eligibility, application, and advance approval by management is essential. To easily identify and understand pay components, pay differentials should be identified on a separate line on the employee’s paycheck.

If you are using geographic pay differentials by job, be certain to perform appropriate market analyses and job benchmarking specific to your industry and job locations when you create pay differentials. Determine if you are recruiting nationally or locally for each job or job grouping.  (Non-exempt, lower-paid jobs are usually recruited in the local labor market, whereas senior and executive-level jobs may be recruited on a national level.)

Your standard for decisions about implementing geographic pay differentials should be the degree to which there are verifiable differences in competitive salary levels across labor markets. Presumably, your compensation philosophy is based on the intention to pay people competitively and fairly.  Use sound methodology – the basic principle that employees expect equal pay for equal work.