
Looking to Benchmark Pay?
Salary Structure Design
The appropriate starting point in pay structure design is to identify and confirm the organization’s core business strategy and the compensation philosophy or strategy, if in existence. Other considerations should include:
- the corporate culture
- financial capabilities and organizational realities
- a long-term orientation
Components of the Structure
When developing a salary structure, the external market data can be aligned to ensure internal equity. Then in configuring the pay ranges, we can finalize a salary structure with the help of four basic characteristics:
- breadth of the pay range
- number of pay grades
- midpoint progression
- overlap
A salary structure with consistent ranges can be developed if you know the bottom and top of the salary structure, the slope of the pay line, and any two of the three characteristics just cited. Using this approach, the third will be determined.
A salary structure may also be developed by determining midpoints, or competitive market rates, for grades by using survey statistic linear regression analysis. This is the statistical technique of drawing a straight line from the market rate of the lowest valued job in the organization to the market rate of the highest valued job in the organization to identify a market trend line. With this, you may make decisions regarding the organization’s base policy line. DLC Course 82, Creating a Market Competitive Salary Structure, reviews the methodology to develop a salary structure using regression analysis.
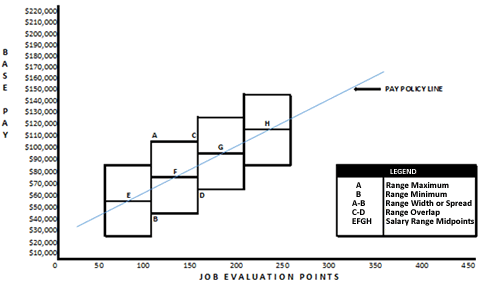
The graph below is an example of straight-line regression used to calculate the midpoints of a salary structure.
Excel RATE formula
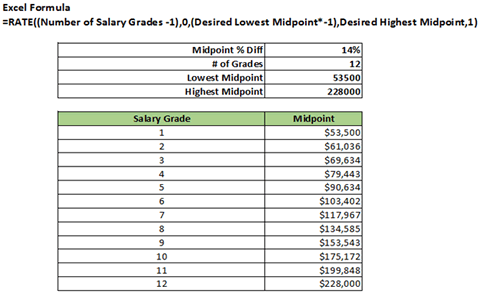
There are several different approaches that may be used to develop or identify midpoints within a pay structure, but one approach will utilize Excel's RATE formula. Using Excel's RATE formula, you may calculate the fixed percent difference between each salary range midpoint to develop your salary structure. All you need is the desired lowest midpoint, the desired highest midpoint, and the number of desired salary grades. The formula is shown in the example below:
=RATE(12-1,0,53500*-1,228000,1)
The result is 14%
In this example, the lowest midpoint (Grade 1) of $53,500 can be multiplied by 1.14 (the midpoint progression) to produce the midpoint for Grade 2. Continue the calculations up to the maximum of the salary structure.
When using a straight regression line or the excel formula, always check the market competitiveness at each salary grade to ensure the salary structure is appropriate for your organization.