
Looking to Benchmark Pay?
Salary Increase Matrix Formation
Once you have a salary structure with established grades and ranges, you can develop a merit increase chart to determine pay increases for individual employees. DLC Course 77: Pay-for-Performance discusses how to evaluate employee performance. As described in this course, a salary increase matrix is extremely useful for establishing pay increases based on the employee's position within the range and performance rating. Example of a salary increase matrix:
Pay-for-Performance Salary Increase Matrix
| Performance Rating | First Quartile | Second Quartile | Third Quartile | Fourth Quartile | |
|---|---|---|---|---|---|
| Outstanding Performance (1) | 8% | 7% | 6% | 4% | |
| Exceeds Expectations (2) | 5% | 4% | 4% | 3% | |
| Fully Competent (3) | 4% | 3% | 3% | no increase | |
| Meets Minimum Expectations (4) | special consideration | no increase | no increase | no increase | |
| Fails to Meet Expectations (5) | no increase | no increase | no increase | no increase |
Constructing a salary increase matrix
In constructing a salary increase matrix, it is essential that the percentage increase be anchored to the midpoint based on two criteria:
- Appraisal score or rating
- Compa-ratio for the coming midyear date
To do this, model these variables in a matrix format using the below calculation:
Performance Distribution x Range Distribution x Increase Percentage
Example of salary increase matrix formation
The company's compa-ratio shows that 1/2 of its employees are below the midpoint, 1/4 are at or near the midpoint, and 1/4 above the midpoint in the top of the range. It utilizes a performance appraisal technique where 1/3 of all employees are higher performers, 2/3 are average, and 0% are unsatisfactory. It wishes to increase salaries an average of 3% for the coming year. In preparing a salary increase matrix that has a horizontal axis of range position and a vertical axis showing appraisal scale, how would the compensation analyst position the percentage increases in order to achieve the 3% average?
Salary increase matrix formation solution
First, set up the axes for the matrix. Remember, for our illustration we are assuming that 1/3 of all employees are high performers, 2/3 are average, and 0 are unsatisfactory. Therefore, there are three levels on the appraisal scale axis:
- High
- Average
- Unsatisfactory
The range position axis also has three levels:
- Top (above the midpoint)
- Middle (at or near the midpoint)
- Bottom (below the midpoint)
Multiplying the two populations in each cell gives you the following:
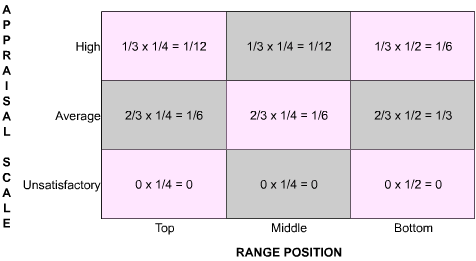
Now, you will need to multiply the fractions found in the above matrix by the percentage increases for each cell. The sum of the products of all cells then must be equal to the 3% average increase forecasted in the budget. To determine the percent increase for each cell, you will need to conduct some sensitivity analysis by choosing some initial increase percentage to enter into your matrix, then test and modify until you achieve the 3% average increase. This process can be accomplished when you set up the matrix in a spreadsheet.
The matrix below presents percentage increases that we have chosen as a starting point:
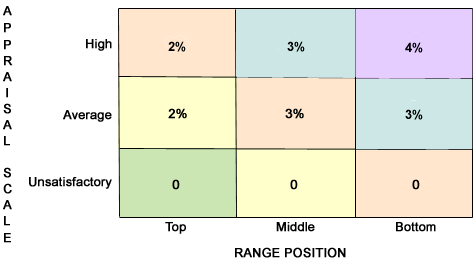
Multiplying the arbitrarily chosen increase percentages to the population in each cell will give you the following:
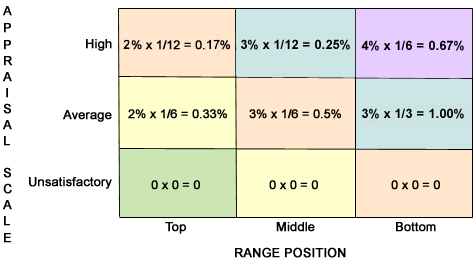
Now, add the above percentages together and compare them to your desired 3% percentage increase.
0.17% + 0.25% + 0.67% + 0.33% + 0.50% + 1.00% = 2.92%
Your result is 2.92% compared to a 3% budget. Therefore, you must fine-tune this chart by modifying the percentage increase you arbitrarily picked for each cell in order to come closer to your budget. Let's change the top center cell from 3% to 4%.
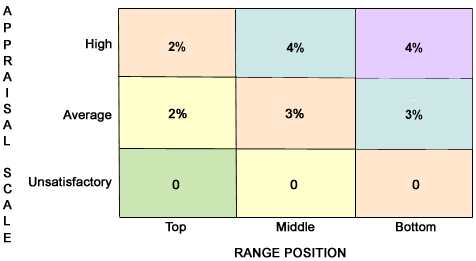
Again, multiply these new chosen percentage increases with the population in each cell.
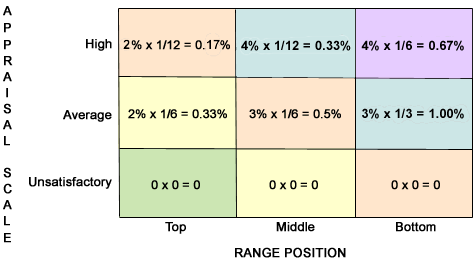
Adding these percentages will give you the desired 3% average increase. You can conduct sensitivity analysis with different percentages in each cell of the matrix to achieve your target.
Memory Jogger
Your company's compa-ratio shows that 1/5 of your employees are in the top range, 2/5 in the bottom range, and the rest evenly distributed between the high-middle and low-middle ranges. Your performance appraisal system rates:
- 1/3 of all employees as high performers
- 2/3 as average
- 0 as unsatisfactory
Based on this information and the increase percentages utilized in the previous year, you have set up the following matrix:
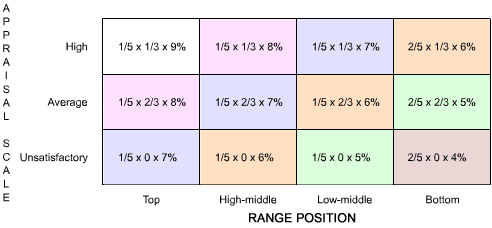
Click on the graphic to view a larger version.
What is the overall salary increase according to the salary increase matrix?