
Looking to Benchmark Pay?
Grades and Ranges
Organizations establish compensation frameworks to manage the financial progression of employees within their organization and pay grades and pay ranges are the compensation tools that often comprise the core of this framework.
| Pay grades | The descriptive ranking of jobs into fewer groupings than the number of jobs present. |
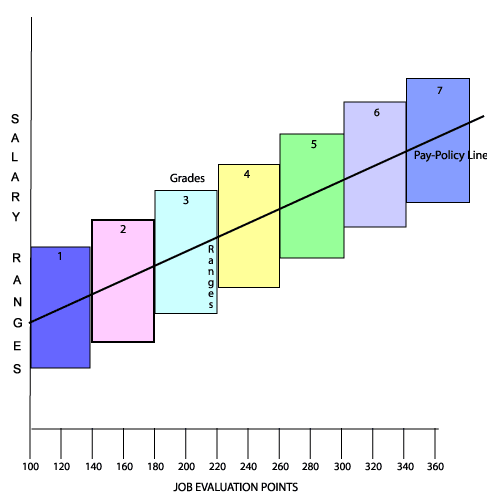
In the graph below, pay grades are the colored rectangles and the pay range is reflected in the height of each rectangle. So, the minimum pay for a grade is the bottom of the rectangle, and the maximum is the top of the rectangle.
Salary Structure
Pay grades allow for a transition from the job evaluation model to one that permits assignment of monetary values. As described in DLC Course 34: Using Job Evaluation in Your Organization, companies conduct job evaluation to rate each job in its importance to the organization. This is done quantitatively, through the assignment of a point value to each job. Then jobs within specific job evaluation point ranges are grouped together into pay grades.
Example: In the salary structure illustrated above, jobs given 100-140 job evaluation points are in Salary Grade 1.
The distance between the midpoints of two adjacent grades is called the midpoint differential. This can vary from 10% to over 100% depending on how the pay grades are designed.
Grades vary in number, as do the number of steps within a grade. Normally, the grade's midpoint differentials increase at a set percentage, such as 10%.
Also, grades demonstrate a statistical technique known as blocking of error. This procedure is designed to smooth variances.
| More Grades | Less Grades |
|---|---|
|
|
Usually, each grade will provide a range of pay with a:
- minimum
- midpoint
- maximum
| Salary range | The spread of pay given to jobs in a single pay grade, from the minimum to the maximum. Ranges allow an employer to recognize differences among employees performing the same or similar job but at different performance or experience levels. |
The spread of salary ranges typically varies from 20% - 50% around a midpoint. However, ranges for executive positions may be much larger, allowing top executives to be paid up to 100 times the minimum level if their performance merits it.
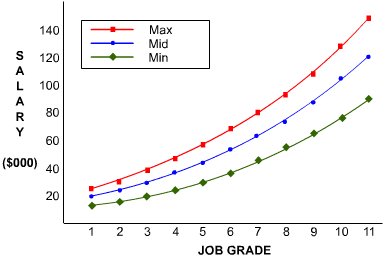
The graph below shows the minimum, midpoint, and maximum of 11 grade ranges. The blue line represents the pay-policy line. The lines are curved because the midpoint differential for the grades uses the same percent increase applied to progressively larger midpoint values.
Memory Jogger
In a salary structure, the distance from the minimum to the maximum pay for a grouping of jobs is called the pay: