
Looking to Benchmark Pay?
Example of grades and ranges
You are in the process of establishing a grade system and defining ranges. The organization currently has one grade with a midpoint of $34,000. You are asked to construct a 10-grade system with a differential of 12% between midpoints and a 40% range spread between minimums and maximums.
First, find the midpoints of the 10 grades. For lesser jobs within the organization, it may be prudent to introduce grades with midpoints less than $34,000, similar to Grade 1 shown below.
| Grade 1 | $34,000 x 0.88 = $29,920 |
|---|---|
| Grade 2 | $34,000 |
| Grade 3 | $34,000 x 1.12 = $38,080 |
| Grade 4 | $38,080 x 1.12 = $42,650 |
| Grade 5 | $42,650 x 1.12 = $47,768 |
| Grade 6 | $47,768 x 1.12 = $53,500 |
| Grade 7 | $53,500 x 1.12 = $59,920 |
| Grade 8 | $59,920 x 1.12 = $67,110 |
| Grade 9 | $67,110 x 1.12 = $75,163 |
| Grade 10 | $75,163 x 1.12 = $84,183 |
*The numbers are rounded to the nearest dollar.
Then find the maximums and minimums around these midpoints. Since the spread between minimums and maximums is 40%, adjust the midpoint upward 20% to find the maximum and downward 20% to find the minimum.
| Grade | Minimum ($) | Midpoint ($) | Maximum ($) |
|---|---|---|---|
| 1 | 29,920 x (.8) = 23,936 | 29,920 | 29,920 x 1.20 = 35,904 |
| 2 | 34,000 x (.8) = 27,200 | 34,000 | 34,000 x 1.20 = 40,800 |
| 3 | 38,080 x (.8) = 30,464 | 38,080 | 38,080 x 1.20 = 45,696 |
| 4 | 42,650 x (.8) = 34,120 | 42,650 | 42,650 x 1.20 = 51,180 |
| 5 | 47,768 x (.8) = 38,214 | 47,768 | 47,768 x 1.20 = 57,322 |
| 6 | 53,500 x (.8) = 42,800 | 53,500 | 53,500 x 1.20 = 64,200 |
| 7 | 59,920 x (.8) = 47,936 | 59,920 | 59,920 x 1.20 = 71,904 |
| 8 | 67,110 x (.8) = 53,688 | 67,110 | 67,110 x 1.20 = 80,532 |
| 9 | 75,163 x (.8) = 60,130 | 75,163 | 75,163 x 1.20 = 90,196 |
| 10 | 84,183 x (.8) = 67,346 |
84,183 | 84,183 x 1.20 = 101,020 |
*The numbers are rounded to the nearest dollar.
Your new grade system is:
| Grade | Minimum ($) | Midpoint )$) | Maximum ($) |
|---|---|---|---|
| 1 | 23,936 | 29,920 | 35,904 |
| 2 | 27,200 | 34,000 | 40,800 |
| 3 | 30,464 | 38,080 | 45,696 |
| 4 | 34,120 | 42,650 | 51,180 |
| 5 | 38,214 | 47,768 | 57,322 |
| 6 | 42,800 | 53,500 | 64,200 |
| 7 | 47,936 | 59,920 | 71,904 |
| 8 | 53,688 | 67,110 | 80,532 |
| 9 | 60,130 | 75,163 | 90,196 |
| 10 | 67,346 | 84,183 | 101,020 |
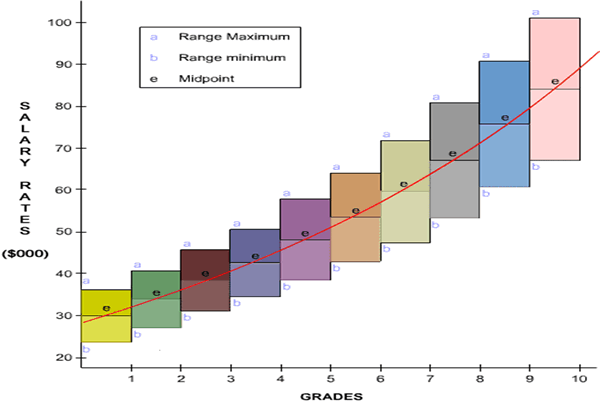
The chart is a graphical resentation of the data showing grades, ranges, and the pay policy line.
Memory Jogger
Your organization has the following grade system:
| Grade | Min ($) | Midpoint ($) | Max ($) |
|---|---|---|---|
| 1 | 18,759 | 25,000 | 31,250 |
| 2 | 21,375 | 28,500 | 35,625 |
| 3 | 24,368 | 32,490 | 40,613 |
| 4 | 27,779 | 37,039 | 46,299 |
*The numbers are rounded to the nearest dollar.
What is the range spread between minimums and maximums in your grade system?