The Impact of Salary Caps on NYS Nonprofits

In New York State, when the state legislature failed to act to place caps on executive salaries in nonprofits providing state-funded human services, the state implemented regulations to achieve the same goal (see http://executiveorder38.ny.gov/ for more information).  However, State Supreme Court Judge Thomas Feinman of Nassau County rejected those caps in a recent decision on a lawsuit by the Agencies for Children’s Therapy, a non-profit that represents more than 30 agencies that provide early intervention, prekindergarten, special education and other services to children throughout the state.  More information is available here.

The judge thought that the Department of Health had overstepped its boundaries and noted that the state legislature had already rejected similar proposals.

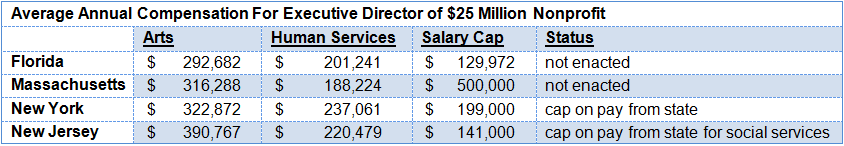
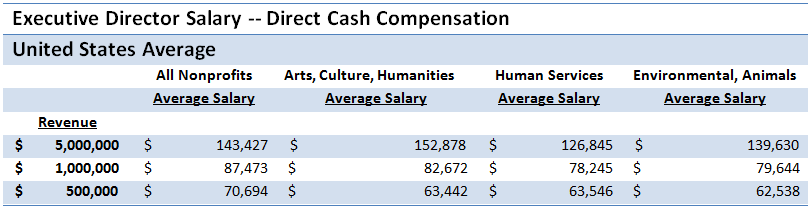
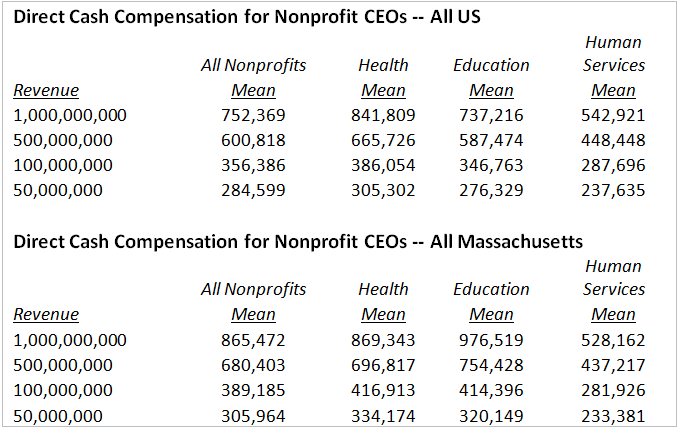
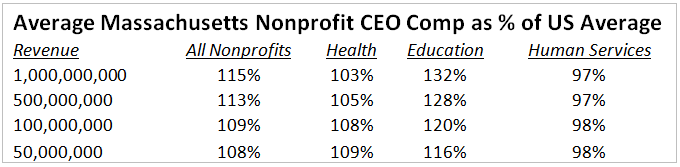
No information is available on whether or not the state will appeal this ruling, but an analysis of the Form 990 data on salaries for New York State (NYS) nonprofits that provide human services and typically receive state funds show why the salary caps were of concern to the nonprofits.  As is typical, the mean salaries for executive directors increased with the size (based on annual revenues) of the organization.  ERI’s analysis using the Nonprofit Comparables Assessor shows that an organization with revenues of $20 million or more on the average pays its executive director more than the cap of $199,000.

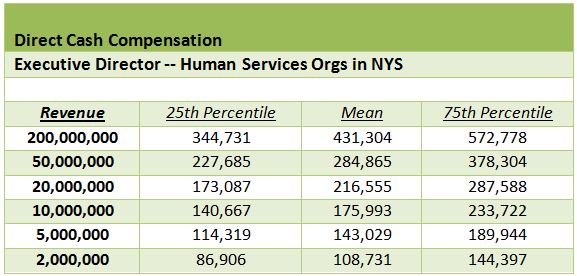
Some of the NYS human services organizations included in the above calculation may not be covered under the current salary cap regulations as they may not receive state funds to provide services, or may be exempt from the cap for some other reason.  But the table above does provide information on the market rate for executive directors of these types of organizations.  For those covered by the cap, there would be a significant impact.

The IRS regulations call for salary data for similar nonprofits to be used in salary determination, and typical criteria to determine comparability include size, location, and type of services provided.  The IRS does not use arbitrary salary caps but requires that the executive boards setting the salaries look at appropriate comparable data.

The salary data do indicate why NYS human services organizations are concerned about the salary cap and why a lawsuit was launched.  The table below details the number of NYS organizations in each of three different size categories (roughly small, medium and large), with an estimate of the number and percent of organizations impacted by the salary cap.

It is clear that an arbitrary salary cap does not take into account one of the main criteria for setting salaries — size of the organization.  It appears that larger organizations in NYS will especially have a difficult time attracting and retaining top executives if the salary cap is fully implemented.

Job Analysis and FLSA Executive Exemption Test

In March 2014, significant changes were proposed to the Fair Labor Standards Act and targeted for likely enactment in mid to late 2015; they are still pending a public notice and comment period.  One of the changes that employers should follow is the possible elimination of the concurrent duties exemption of primary duties for the executive exemption test.

Some employers rely on this provision for first time supervisors promoted from non-exempt positions who now have new “performance manager” and “operations manager” responsibilities.  These new responsibilities qualify them for executive exemption, yet such employees concurrently spend substantial amounts of time performing the non-exempt duties of their previous roles.  For example, a hotel’s housekeeping supervisor will manage housekeeping and the staff, yet is expected to perform general housekeeping duties when there is down time.  The gray area is the percent of time spent on “executive duties.”  Other than California (which requires 50% of primary duties to be executive duties), the other states do not quantify the threshold.

To comply with the FLSA executive exemption, the employer should conduct a job analysis using a systematic approach to collecting job content.  Then the job analysis results need to be evaluated against three specific criteria for the executive exemption test:

  1. Primary duty is management of the enterprise or of a customarily recognized department or subdivision;
  2. Customarily and regularly directs the work of two or more other employees; and
  3. Authority to hire or fire, or having suggestions and recommendations given particular weight as to hiring, firing, advancement promotion or any other change of status to other employees.

Below are two screenshots from ERI Economic Research Institute’s Occupational Assessor, a job analysis application for employers to use in assessment FLSA exemptions.

Screenshot #1:  Here, the user summarizes job analysis results into the primary duty and top four responsibilities, which in total comprise 100% of the job content.  The analyst is also required to specifically assign percentages for each duty.

Screenshot #2:  The user documents his or her evaluation of the criteria for the executive exemption by answering and providing justification of the responses, as displayed in the image below.

ERI anticipates that most retail or consumer service industries will be affected by this possible change, requiring them to either redesign jobs and operations workflow or simply reclassify these jobs as non-exempt and pay overtime.   To learn more about how you can effectively manage FLSA related job analysis, call ERI at 1-800-627-3697.

Compensation for Art Museum Directors: Do Men Really Get Paid More?

The Association of Art Museum Directors recently reported that only 43% percent of art museums in the United States and Canada were headed by women, and salaries of those female directors averaged 79% of the salaries of their male peers.

The research showed that the gap varied with the size of the museum, as in these examples:

  • In museums with annual budgets less than $15 million, women directors actually make $1.02 on the dollar paid to male counterparts. There are many more women in these director positions.
  • In museums with budgets over $15 million, less than a quarter of the top positions are held by women, and they make 71 cents on the male dollar.
  • As the museums get larger, the number of women directors decreased.  The report found, at 33 art museums with annual budgets over $20 million, only five were run by women.

ERI’s Nonprofit Comparables Assessor provides some insight on the actual level of salaries for museum directors across the United States, as reported on the Forms 990 filed annually with the IRS by each museum.

The table below lists the average salaries by size of the museum, as measured by annual revenues, but with no division by gender.

What is clear from the ERI analysis of Form 990 compensation data above is that directors of larger museums get paid much more than those of small museums.

Reviewing the names of the directors can give an initial view of the male-female differences, but more research is required for some names that are not easily assigned a gender.  With that caveat, consider these findings:

  • Of the 20 highest paid directors of smaller museums (organizational revenues between $1 million and $5 million), 8 were women; there were 457 museums of that size category, and almost 40% of the total were headed by women.
  • Of the 20 highest paid directors of larger museums (revenues between $25 million and $50 million), 4 were women; there were 36 museums in that size category and, overall, less than a third were headed by women.

While the ERI analysis of director salaries by gender tends to confirm the findings of the Association of Art Museum Directors report, the method that nonprofit organizations need to use to set compensation that complies with IRS regulations remains the same – salary data from comparable organizations must be collected and analyzed. ERI’s Nonprofit Comparables Assessor provides a way to analyze the data by size, location, and by gender of the director to help ensure that there is no discrimination in setting compensation.

Discussion of CEO Ratios Moves to Government and Nonprofits

As the US slowly emerges from the recent recession, indications of increasing “income inequality” have become the focus of much discussion, and some action.  Research by the Economic Policy Institute (see www.epi.org/publication/unequal-states/ for more details) reveals the following:

  • Between 1979 and 2007, the top 1% of US taxpayers took home over half of the total increase in US income.
  • Over this same period, the average income of the bottom 99% of US taxpayers grew almost 19%, while the average income of the top 1% grew over 10 times as much—by over 200%.
  • Incomes at all levels declined in the recent recession, but, when income began to grow again in 2009, it was not even – in fact, the top 1% captured 95% of total income growth from 2009 to 2012, according to University of California at Berkeley economist Emmanuel Saez.
  • By 2012, the most recent year for which data are available, the top 1% earned 22.5% of all income in the US.

The recent Securities and Exchange Commission requirement that publicly held companies calculate and disclose the ratio of CEO pay to the pay of the company’s median worker will highlight the salary difference between the executives and the average worker.  In 2012, according to the Economic Policy Institute, that ratio was typically 273:1.  For reference, management guru Peter Drucker once said that the ratio of CEO pay to worker pay should be no more than 20 to 1.

Now some public and nonprofit organizations are joining this discussion, since they exist “to serve the public good,” with salaries subject to public scrutiny.  At St. Mary’s College, a small liberal arts college affiliated with the University of Maryland (a public state university), a proposal to cap the ratio between the president’s salary and the average worker at the college at 10:1 was recently discussed (and then defeated 9:8 in a vote by the Faculty Senate).  The current ratio is 13:1, already very different from the ratio in most corporations and at other universities.

With the SEC ratio reporting coming soon for public for-profit corporations and with federal and state legislative efforts to raise the minimum wage, look for more proposals to address increasing income equality, both from shareholders of companies and from “stakeholders” – such as clients, funders, and the public —  in nonprofit organizations, and even with government entities.  In the meantime, setting compensation using data from comparable organizations is the method most often used – and the only method approved by IRS for nonprofits.  ERI’s Nonprofit Comparables Assessor provides easy access to that needed data for nonprofits, while the Executive Compensation Assessor focuses on for-profit data.

Tracking Nonprofit Executive Salaries – Nursing Homes

While economists and various pundits endlessly review each new government jobs report for impact on the recovery and growth of the US economy, one trend may have slipped by most observers – the difference in job growth among the for profit and nonprofit sectors.

Close to 11 million workers in the United States are now employed in the nonprofit sector, representing over 10% of the total work force.  While post-recession recovery in the number of jobs has been sluggish overall in the for-profit sector, nonprofit employment was been much less affected and has continued to grow.  The primary reason for the difference is that most nonprofit work is in three fields – health (57%, including 37% in hospitals), education (15%), and social assistance (13%).  As the overall growth in US jobs in recent years has been in service industries, a higher proportion of the jobs created have been nonprofit sector jobs, most of which provide services.  In general, nonprofit employment is concentrated in the growth areas of the economy, while for-profit employment has been concentrated in the fields that have been shedding jobs.

More details on nonprofit employment trends are available in a recent report by Johns Hopkins University’s Center for Civil Society. The study reports that growth in health employment has averaged 2% per year from 2000 to 2010, but it differs by field:

While the number of jobs in certain fields has grown, how has that translated into salaries?  Using ERI’s Nonprofit Comparables Assessor, the table below shows the considerable geographic variation in compensation for executive directors of nonprofit nursing homes of different sizes, based on data reported on the annual Form 990.  Remember, this is a census, rather than a survey, because all nonprofit nursing homes are required to file the form with the IRS.

Setting nonprofit compensation requires the collection and use of comparable data, according to IRS rules.  Obviously, depending on the size and the location of a nonprofit nursing home, the appropriate salary for the director needs some documentation, and is easily accessed from ERI’s Nonprofit Comparables Assessor.


Deadline Extended for ERI’s Health Care Benefits Survey

There’s Still Time to Participate
Don’t miss out on contributing to ERI Salary Surveys seventh annual Health Care Benefits Benchmarking Survey. Participants save 50% off the results! We’ve extended the deadline to accommodate even more employers in the public, private, and nonprofit sectors, as well as government entities in the United States.

Save 50% Off
A 50% discount is available to organizations that participate before February 7, 2014. Participate now and pay later. Your submission locks in the participation discount for when you’re ready to purchase. The survey covers the following details:

  • Eligibility Requirements
  • General Features of Medical Coverage
  • Types of Medical Plans Offered
  • Opt-Out Provisions
  • Co-Payments and Coinsurance Amounts
  • Employer and Employee Medical Plan Costs
  • Prescription Drug Plan Co-Payments
  • Cost-Saving Measures
  • Types of Dental Plans Offered
  • Employer and Employee Dental Plan Costs
  • Vision Benefits

Benefits in Nonprofit Organizations Survey
Additionally, ERI Salary Surveys sponsors a companion benefit report for nonprofit organizations, covering health care insurance, general benefit practices, disability insurance, retirement plan practices, paid leave, and executive perquisites. Participate before March 31, 2014, to receive a 50% discount off the final report. Participate in the Benefits in Nonprofit Organizations Survey

Are you an ERI Assessor Series® subscriber? If so, participate in any of our applicable surveys to receive a PDF version of the results for free.

Data collection began on October 1, 2013, and ends on February 7, 2014, for the Health Care Benefits Benchmarking Survey and ends on March 31, 2014, for the Benefits in Nonprofit Organizations Survey. Survey results will be published in April 2014 (Health Care Benefits) and July 2014 (Benefits in Nonprofits.) All survey participants will receive a complimentary copy of the Executive Summary. Participation discounts do not apply to Assessor subscriptions. For more information or to request participation materials, please visit www.salary-surveys.erieri.com or call 1-877-210-6563.

States Target Nonprofit Executive Pay

Should nonprofit executives “volunteer” a part of their compensation (by receiving a discounted salary) because they work for a charitable organization?  Alternatively, is a “high” salary important to attract the kind of talent needed to achieve the purpose of the nonprofit?  The IRS says that pay must be reasonable and that salary data on comparable jobs in comparable organizations must be used to document that what is paid is appropriate.  However, some states are moving to supplement that IRS scrutiny at the federal level with some limits on salaries for nonprofits at the state level.  (More discussion at http://www.cbiz.com/page.asp?pid=10098)

When nonprofits are funded by state grants and contracts, proponents of executive salary caps say that taxpayers should not pay high salaries.  As in the private sector, there is concern that executive pay is too high as a multiple of the average worker’s pay, although it seems unlikely that an executive salary cap will cause other salaries to increase.  Other advocates of salary caps contend that they will reduce the state’s costs and that additional money needed for the executives can be funded from other sources, like federal grants or private donations.  However, critics say that pay limits would make it much more difficult for nonprofits to hold onto top executives and recruit qualified new ones.  If a high salary results in higher revenue for the organization, they contend it is money well spent.

While the debate about state regulations continues, some of the organizations that pay the highest salaries, such as hospitals, may not be affected, as their revenues may come from the federal government or from private philanthropy rather than via state funds.

Currently, New York and New Jersey actually have some regulations in place, setting salary caps on nonprofits that receive state revenues.  In Massachusetts, legislation has been proposed, and the Attorney General has issued several reports on high pay which illustrate the state’s concern.  In Florida, legislation was also discussed but not enacted.

The different existing regulations and legislative proposals contain a lot of details which must be considered to fully assess the impact of a cap on nonprofit salaries, but below is a table providing an overview, developed using ERI’s Nonprofit Comparables Assessor.  The average annual pay for an Executive Director of two types of organizations (Arts and Human Services) with $25 million in annual revenues is shown in the four states, along with the salary cap under discussion or in force.

This table illustrates several points:

  • Arts organizations pay their EDs much more than human services nonprofits.
  • Florida salaries are often lower than in the other states.
  • Salary caps, if implemented as proposed in Florida, could have a major impact; but the impact for Massachusetts would be much less because of the higher cap under discussion.
  • The caps in effect in NY and NJ might have a significant effect, but the various exemptions available have mitigated that impact for many organizations.

As the Massachusetts AG’s report suggests, “nonprofit compensation committees … should consider their charitable mission, how the executive pay compares to other workers’ salaries, and take into account the amount of public support the nonprofit receives from its tax-exempt status.” Legislators in many states as well as the IRS regulators are watching closely as these compensation decisions are made.

A Modest Suggestion on Pay for Nonprofit Executives

A recent blog by George Weiner suggests the following approach for a nonprofit to reduce those pesky overhead costs that are so often the focus of criticism:

One-Year Overhead Plan

In response to the changing demand of funders we are looking to reduce all overhead including but not limited to office space, technology and software, salaried employees, donation processing fees, benefits, impact analysis and transportation costs. Ideal candidate should be able and willing to bicycle (or drive at own expense) to retrieve our donor’s sacks of cash to deliver directly to our stakeholders.

Salary: $0 (incommensurate with experience)

Benefits: Working for an incredible cause, warm fuzzy feelings

Obviously, this modest suggestion reflects the ongoing frustration of nonprofits in responding to critiques of their compensation levels to all their stakeholders – donors, funders, clients, federal and state regulators, as well as the public, informed by the media.  Most of the attention on compensation is concentrated on where most of the money is in the nonprofit sector – the large “meds” (hospitals and health organizations) and “eds” (colleges and universities).  But the negative fallout from high compensation for some organizations is felt by the whole sector.

The table below uses the ERI’s Nonprofit Comparables Assessor to calculate average salaries for Executive Directors of nonprofit organizations of smaller sizes, which comprise the vast majority of the nonprofit sector.  The Form 990 data show that the head of a typical $1-million organization would be expected to earn around $87,500.  Executive Directors of Human Services organizations with $1 million in annual revenues have a typical salary of around $78,000, while those in Arts and Environmental organizations fare slightly better.  These smaller organizations and these salaries are far more typical of the nonprofit sector than the large “meds” and “eds.”

Clearly, these salaries are not very high.  When an organization of these typical sizes and types pays much more than the average salaries shown, a responsible board of directors needs to be able to justify its compensation practices.  But it is clear that most nonprofit executive salaries are not what could be considered high.  When the much higher compensation levels in a few organizations is criticized, the smaller organizations, even though paying much less, also need to be able to show the reasonableness of their executive salaries.

ERI’s Nonprofit Comparables Assessor can easily show what salaries would be expected in various types and sizes of organizations; a specific geographic location can also be added as a criterion to complete the analysis needed to determine comparable compensation.  To learn more about average salaries in the nonprofit sector and where the highest salaries are likely to be found, check out ERI’s white paper “Charity Executive Pay.”

Nonprofit CEO Compensation in Massachusetts – Too High or Not?

Massachusetts Attorney General Martha Coakley released a December report on nonprofit executive compensation highlighting some high salaries, particularly in the health and education fields (see http://www.mass.gov/ago/docs/nonprofit/ceocomp/ec-review.pdf for the complete report).

The report states, “While CEOs at for-profit companies have commanded the highest compensation packages, CEO compensation at public charities has also increased. In fact, high executive compensation at public charities frequently leads to greater levels of concern, because of the view that large compensation packages take money away from charitable missions. They can also negatively affect the perception of the charities with employees, donors and other constituencies, as well as with the general public. At the same time, the largest public charities are complex organizations in their own right, and demand a level of executive ability that is at least commensurate with that complexity.”

ERI’s Nonprofit Comparables Assessor was used to see how different types of Massachusetts nonprofit CEOs fared in direct cash compensation when compared to their counterparts in the entire United States.

In general, there are significant differences in compensation levels among the different types of large nonprofits (health, education, and human services) in the all US and Massachusetts comparisons shown above.   Compensation in human services organizations is consistently lower.  Also, at the larger revenue levels, health organizations tend to pay more across the US, while, in Massachusetts, the largest education organizations pay more.

So how do the Massachusetts salaries compare with the US averages?  The following table illustrates that, while human services organizations tend to pay less in Massachusetts, both health and education organizations pay higher than the US average (particularly in education).

The AG’s report states that “the organizations in our study approached setting the CEO’s compensation with care and attention to the standards the IRS has set forth creating a presumption that the compensation is reasonable. Despite the care these organizations took in setting CEO compensation, we found little evidence that the process restrained CEO compensation or its growth.”  However, it must be noted that the purpose of the IRS regulations on compensation is to assure comparability, and the focus is on using data from similar organizations to set salaries.  The purpose is not to restrain CEO compensation but to determine market levels.

How this report will be used in Massachusetts is not yet clear, but, until there are regulatory or legislative changes, all nonprofit organizations should be collecting compensation data from similar organizations to assist in the setting of executive compensation.  ERI’s Nonprofit Comparables Assessor provides easy access to that information, allowing the user to choose the relevant type, size, and location of the comparable organizations.

Executive Compensation Analytics: North America and Europe

Organizations will generally have two or three sources of executive and top management compensation benchmarking data to ensure compensation is NOT a reason for turnover at the c-suite and top talent levels.  Compiling and analyzing executive compensation data can be a daunting task especially since the regulatory frameworks for c-suite jobs in some countries vary (e.g. voluntary vs mandatory disclosure; or aggregated vs incumbent-level disclosures).  For top management positions, the scope dimensions of the jobs like P&L responsibility, geography, and targeted niche business are required criteria which may not be available in most compensation solutions.

ERI Economic Research Institute’s cloud-based Assessor Series provides compensation analytics for US, Canada and 11 European countries (e.g. Austria, Belgium, Denmark, Ireland, Italy, Luxembourg, Netherlands, Norway, Poland, Portugal, Sweden) that cover c-suite and top management jobs.  In order to derive a reasonable compensation estimate first an appropriate benchmark job must be identified.   With a few clicks in ERI’s cloud based Assessors, applying a semantic search and then reviewing detailed job description content, the user can select an appropriate job match with a high degree of confidence.  The below are screenshots reflecting this process.

Once the job match is completed, the specific criteria can be set for the executive or top management positions like the industry, geography, and revenue.  Select from over 8,000 geographic areas, 1100+ industries, and setting revenue ranging from $1M up to $30B USD.   Below are the screenshot images for setting the criteria:

Now the user can generate reasonable compensation estimates for the Top Auditor position for North American and Europe with a target 200M revenue scope in the Fabricated Metal Products Manufacturing industry sector.  Below are a screenshots of the results for the Top Auditor position in US and Italy for illustration purposes.

While the base salary compensation analytics is shown, incentive and total cash are also selectable from the dropdown menu.  Also, if you wanted to select more specific geographies like Madison, NJ; Charlemagne, Quebec in Canada; Manchester UK;  Gagny, France or Villaricca, Italy, the cloud-based Assessor series robust geography functionality empowers the user to have laser focus on geographic cost of labor differentials.

Organizations are challenged to make investments in many analytic solutions and compensation is one of the largest line items in most company income statements.  ERI Economic Research Institute’s cloud-based Assessor products provide proven reliable, robust, and cost effective compensation analytics for executive and top management positions in your organization.  For more information regarding these products or ERI’s compensation analytics solutions please call 1-800-627-3697 or visit our website www.erieri.com.