Early Bird Discount Continues for ERI Salary Surveys

Many organizations across the United States and Canada have already submitted their information to receive the early bird discount on our compensation and benefits surveys. Submit your organization’s data before December 31 to ensure 75% off the results. Participate now and pay later. Your submission locks in the participation discount for when you’re ready to purchase.

ERI Salary Surveys offers more than 150 industry and job function salary surveys. Also consider our Health Care Benefits Benchmarking Survey or Benefits in Nonprofit Organizations report.

We’ve made participation even easier. Past online participants have the option to review a pre­vious year’s submission, edit the information, and resubmit the online survey questionnaire. This new feature is automatical­ly available within your existing ERI Salary Surveys account. Simply sign in online and click on Participation History to view your options. Excel and PDF versions of the survey ques­tionnaires are also available via each survey description page.

As a reminder, Assessor Series sub­scribers may participate in any applicable survey for a free PDF copy of the results. Participation discounts, however, do not ap­ply to Assessor Series subscriptions. See our Participate & Save frequently asked questions for more information.

New for 2014!

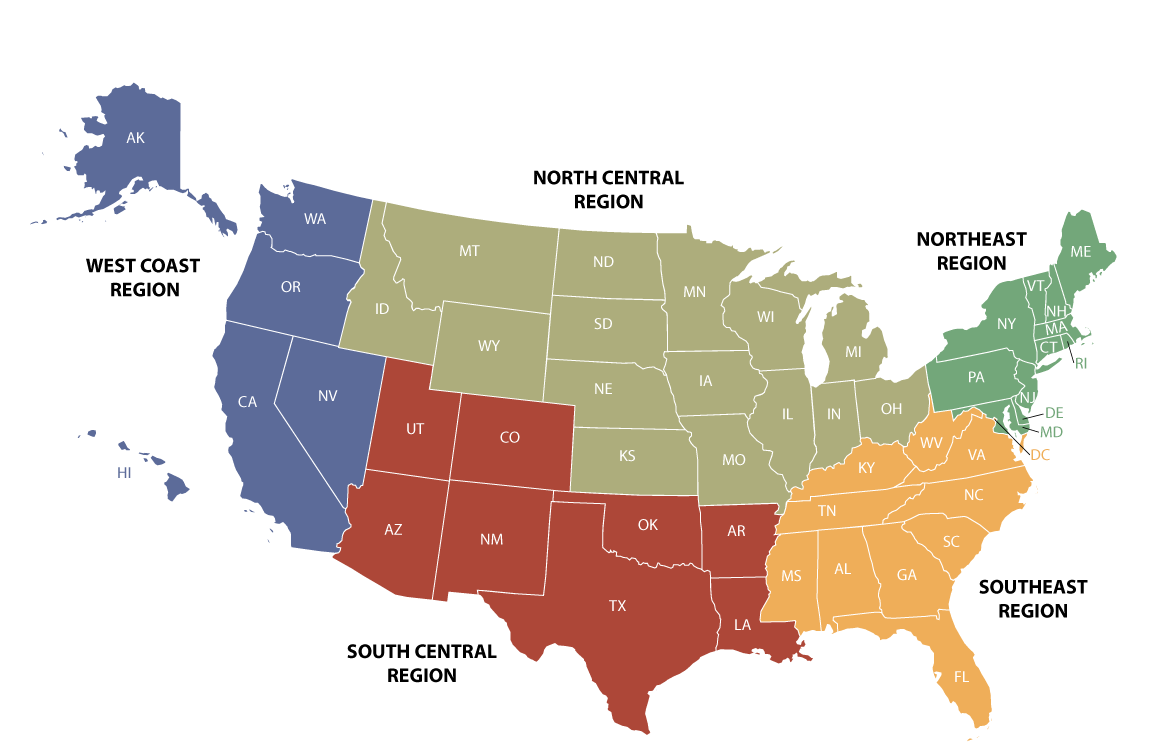
Our 2014 compensation surveys will be available with U.S. regional results. Regions are as follows: Northeast, Southeast, North Central, South Central, and West Coast. U.S.  Canadian national average results will continue to be available.

How Much Should a Nonprofit Pay Its Chief Financial Officer?

How Much Should a Nonprofit Pay Its Chief Financial Officer?

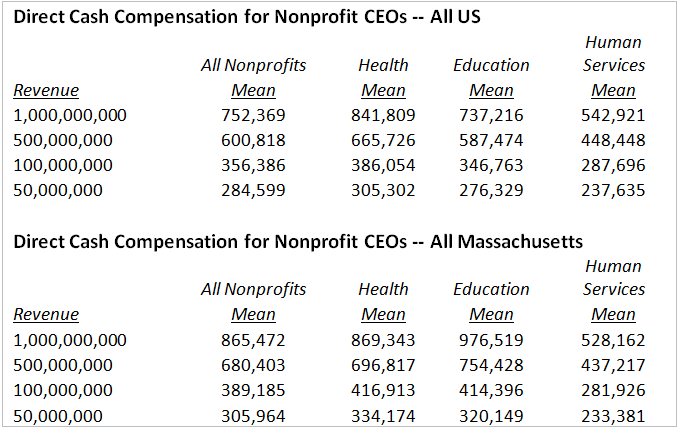
Of course, the answer is “it depends.” In determining market compensation, ERI Economic Research Institute has found through its years of research that the influencing factors are what you do and where you do it. “Where” refers to the kind and size of organization as well as its geographic location. A quick review of the Form 990 data submitted annually by all US nonprofits shows the significant variation in compensation for nonprofit organizations providing human services, based on their size, as measured by annual revenue.

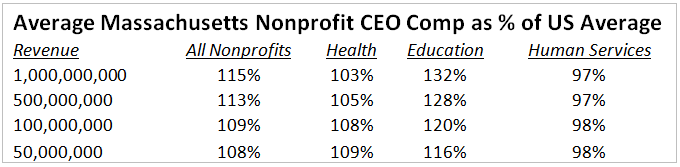
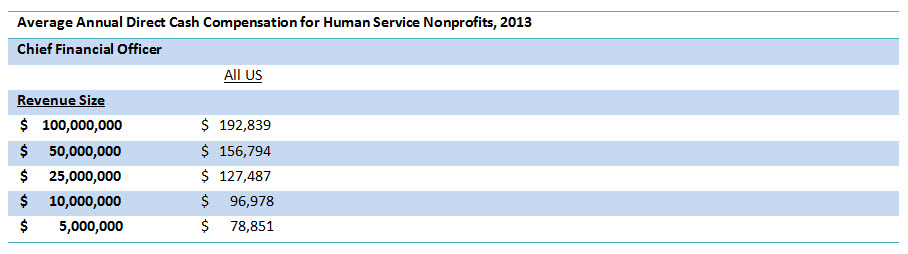
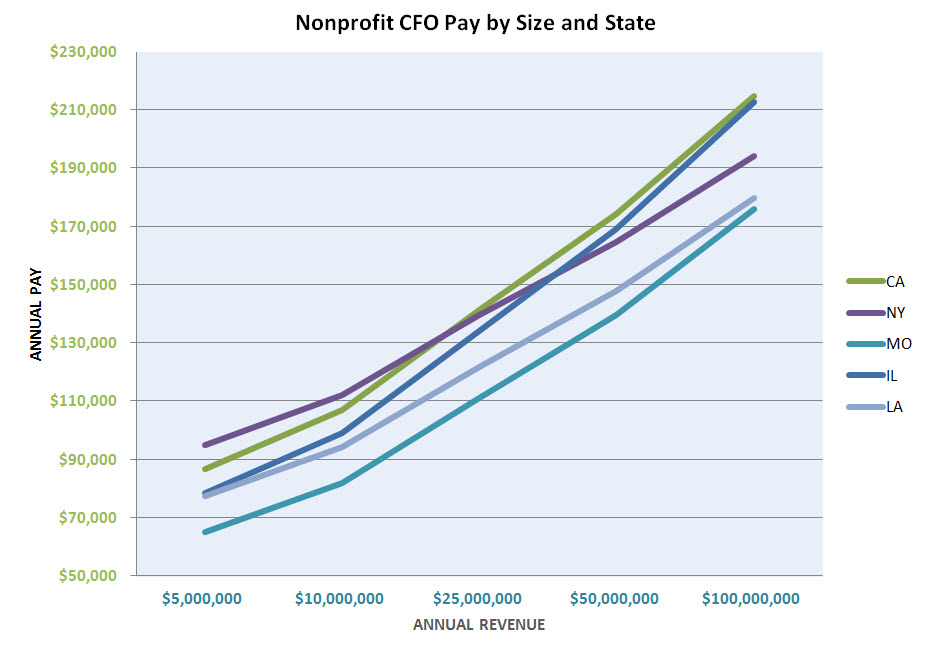
A closer look at the data reveals variety among different geographic areas as well as size.  Direct cash compensation for CFOs in human service organizations of various sizes is illustrated in the chart below:

An accurate assessment of market rates for the CFO position requires looking at comparable organizations providing similar services, but also of similar size and geographic location.  For a large organization, the labor market for the job may be national in scope, so the broader geographical choice may be more relevant.  For a small organization, the search for a nonprofit CFO salary is likely to be state-wide or even city-wide. ERI’s Nonprofit Comparables Assessor allows the user to choose the job title, revenue size, type of organization, and geographic scope to ensure that the most comparable data is used for the calculation.  With a click of the mouse, the user can access the actual Form 990 to find out more details.

Unlike the Nonprofit Comparables Assessor, surveys can include data only from the organizations that respond, not all that file a Form 990.  Rarely are there detailed tables that provide data for just the revenue size, type of organization, and geography that are relevant.  As shown above, the differences in pay are significant, depending on the criteria used.

What Determines Nonprofit Hospital CEO Pay?

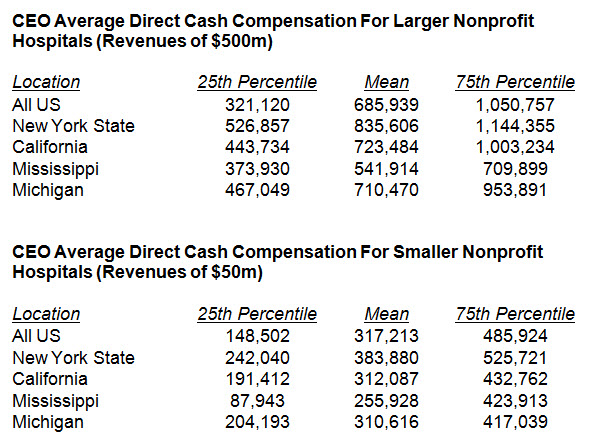
Setting pay is the responsibility of the hospital board, and those board members must collect and use data from comparable organizations and choose the relevant criteria, most commonly size and location. Using ERI’ s compensation data from the Forms 990 contained in the Nonprofit Comparables Assessor, the table below illustrates the wide variation in pay among larger and smaller hospitals in different locations.

Nonprofit hospitals often compete for executive talent with other industries and other sectors (there are both government and for-profit hospitals, of course) and they need all relevant data to set market rates.  Size still seems to have the most influence on compensation –  the bigger the hospital, the more complex it is to manage.

Currently, experts in the health care sector are focused on adding quality of care factors to the compensation determination process and such criteria may grow in influence as boards react to this pressure to pay based on patent outcomes.  A recently-published Harvard study of compensation of CEOs of U.S. nonprofit hospitals found the highest salaries were in larger, urban teaching hospitals (median pay of $1.7 million annually), while top executives in small rural non-teaching facilities were paid much lower (median of $118,000). The data on 1,877 CEOs at 2,681 hospitals came from seven data sources, including Forms 990.  The authors were trying to establish a link between compensation levels and mortality rates for the hospitals – that the CEOs were rewarded with higher pay if there were fewer deaths in their hospitals.  What they found, however, was that pay was higher for more hospital beds, for more use of advanced technologies, and for high ratings on patient satisfaction surveys.

As insurers and government programs such as Medicare are working to link compensation to the quality of care, doctor pay seems to be more influenced by quality scores; however, that trend is not yet evident for hospital CEO pay.  As the tables above show, CEO pay is really influenced by size and location of the nonprofit hospital.  Until there is more evidence of the use of additional factors, the Nonprofit Comparables Assessor can provide the most relevant market rate estimates of compensation, with its choices of size and location.  The software also provides easy access to the source Forms 990, which may provide more detail on additional criteria used to set salaries.

CEO Pay Ratio and Reasonable Compensation Estimates

The Dodd Frank rule requiring public companies to report CEO pay ratio relative to employee pay was approved by the SEC in a 3 to 2 vote and is currently in a 60-day comment period open until December 2, 2013. Once finalized, as early as 2016, publicly-traded companies will need to disclose the CEO’s annual compensation relative to employee annual median compensation and express this comparison as a ratio. Company exemptions are those covered by the JOBS Act (i.e. emerging growth), foreign private issuers, and small reporting companies. Some of the broader operational definitions for implementing this rule follow:

  • Companies will have to report the ratio in annual filings that also require executive compensation disclosure like Proxy Statements or Annual Reports.
  • The workforce covered by this rule are permanent full-time employee, part-time, seasonal, and temporary employees; excluded are consultants, contractors, or temporary staff hired through a third party as leased workers.
  • The compensation components included in the calculation will mirror the Summary Compensation Table pay elements disclosed for the CEO to determine the annual median total compensation of the employee.

To actually perform the ratio calculation, the proposed rule addresses the concerns of many global companies by allowing statistical sampling of employee population in the more “difficult to report” business locations (i.e. due to data privacy regulatory compliance that may be cost prohibitive, or possibly the lack of critical mass in a new or small operation where the resultant statistic would not be meaningful). The flexibility in this requirement allows the company the option of using another consistent measure for reporting the pay ratio that can be based on actual compensation paid and/or estimates, if necessary. The example cited in the proposed rule is selecting cash compensation as “another consistent measure” for locations, pulling the median value from the sampling for that location after smoothing out the observation for outliers, then calculating the total compensation for that employee to be used in the pay ratio.

ERI Economic Research Institute has been providing reasonable compensation estimates to more than 5000 subscribing companies for over 25 years. A compensation estimate is essentially the output of statistical methodologies that use regressions analyses techniques (both single regression and polynomial regression) derived from robust datasets. ERI’s Assessor Series provides estimated cash compensation, which is the sum of the base salary and cash incentive where the incentive data represents an average of all employees in the job, including organization data where no incentive or cash bonus was paid. The Assessor Series includes benchmarking tools for over 6000 executive and non-executive benchmark jobs.

To calculate the median compensation, most companies can rely on the country-specific tax reporting document, such as the W-2 in the U.S., which is a data source that is readily available to organizations. The proposed ruling allows flexibility in formulating the assumptions and methodology while also requiring such information be disclosed in public filings. With some of the lead time to plan for this requirement, companies will need to establish a consistent and reasonable approach with thoughtful transparency to shareholders that will generate valid and reliable median compensation values and related ratios.

To learn more about compensation estimates and related compensation analytic solutions, visit www.erieri.com or call 1-800-627-3697.

Executive Compensation: Performance Relative to Peer Companies

From a business leadership perspective, evaluating performance at the individual or organization level can usually be expressed as “exceeds expectation,” “meets expectations,” and “does not meet expectations.” These performance standards become more meaningful when they are evaluated relative to a peer group, potentially eliminating “rater bias” and allowing better allocation of compensation dollars as well as other human capital investments.

For executive employees, their peer groups and relative performance are anchored to external benchmarks. What is meant by this? For example, in Suburban Propane’s latest Proxy, the company disclosed a peer list of 11 companies and defined their comparability based on the business (i.e. publicly-traded propane marketing partnerships) and tax structure:

  • AmeriGas Partners, L.P.
  • Copano Energy, LLC
  • Dorchester Minerals, L.P.
  • Enbridge Energy Partners, L.P.
  • Energy Transfer Partners, L.P.
  • Ferrellgas Partners, L.P.
  • Global Partners, L.P.
  • Inergy, L.P.
  • MarkWest Energy Partners, L.P.
  • Plains All American Pipeline, L.P.
  • Sunoco Logistics Partners, L.P.

Companies competing in volatile industries that are impacted by macro-economic factors and global events need to evaluate their peer list on a frequent basis and conduct comprehensive analysis to develop a thoughtful business rationale for any peers that may be added or removed. To identify the relevant peer group, companies first define peers in terms of markets in which they compete for products/services and talent. Then, they critically review this list by determining the similarities and differences between them, analyzing the financial performance of these organizations, and evaluating any strategic business intelligence they have about them.

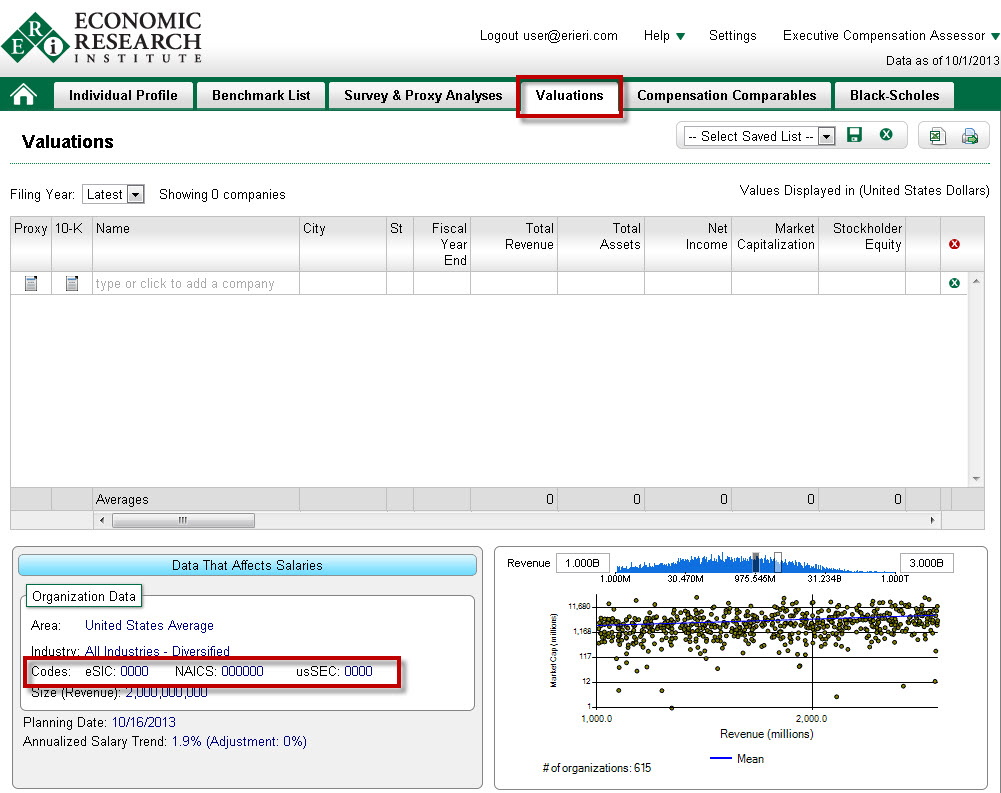
ERI’s Executive Compensation Assessor enables companies to easily create a peer group in order to review the financial performance of companies by downloading into a spreadsheet over 50 financial data elements. To generate a peer list of companies, ERI subscriber define criteria based on industry and revenue size as depicted in the below story board/ screenshots:

From the Valuations tab, click on the industry code field:

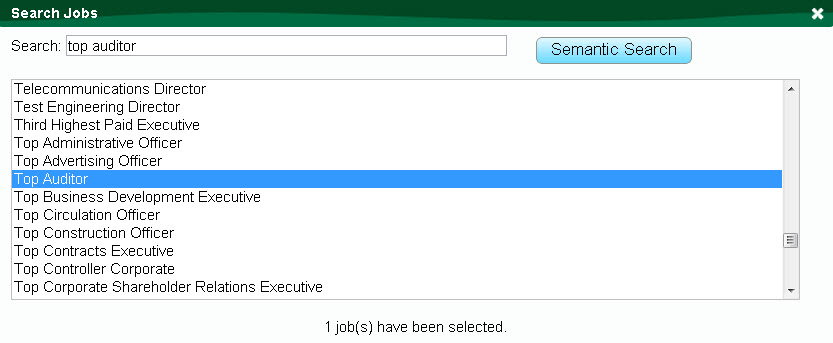
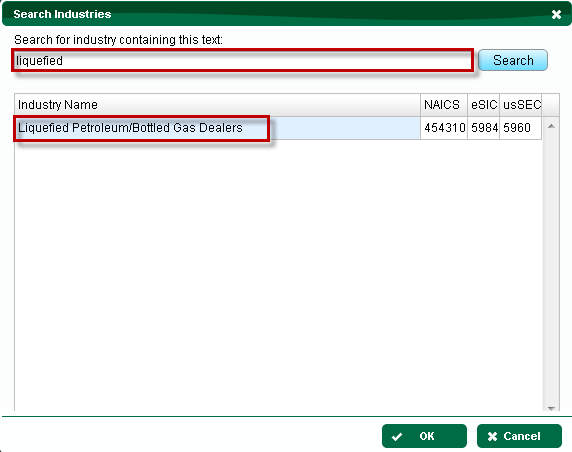
Within a few clicks a Search Industry box will appear and using the industry search text feature the user enters the  description, the industry criteria can be selected for the peer list.  Continuing with the Suburban Propane example, Liquefied Petroleum/Bottled Gas Dealers is the industry that is selected.

Then we expand the revenue range to get the entire population of companies in the output given this is a niche industry and Suburban did not use revenue size in the description of their business rationales for the Peer List as disclosed in their Proxy.

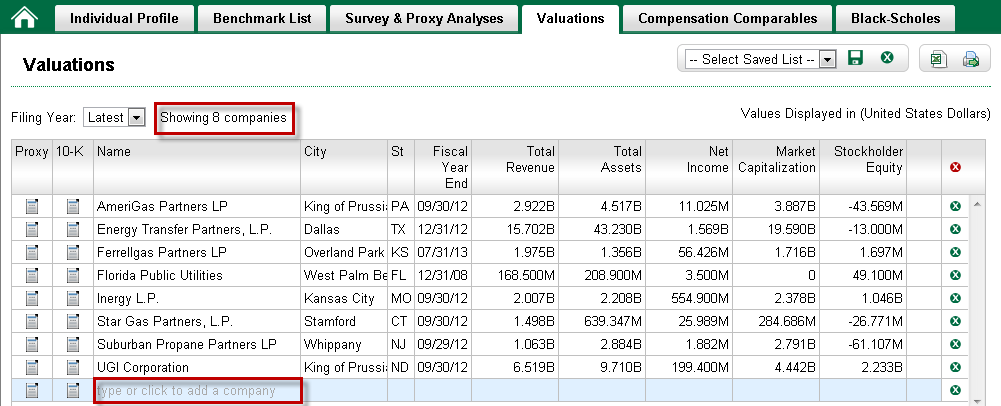
A preliminary peer list with 8 companies is displayed based on the Industry Criteria.  To further customize the list, the user can add companies by clicking on the last “blank” row in the table.

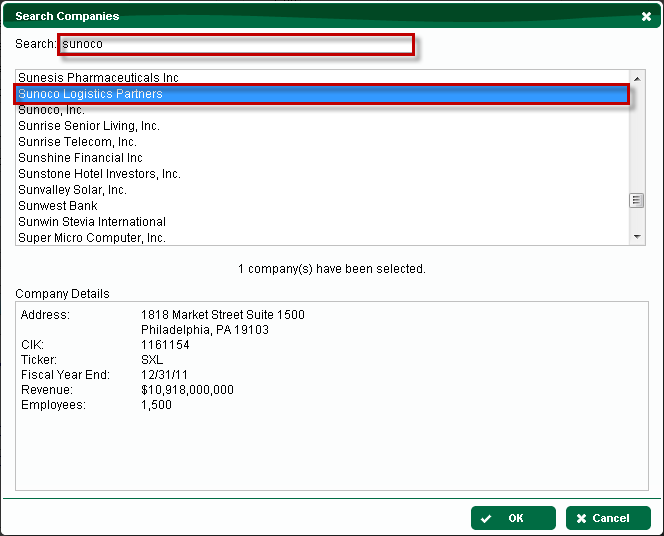
A Search Companies box will display and the user can enter the company name, select from this results and continue to add specific companies until the list is complete.

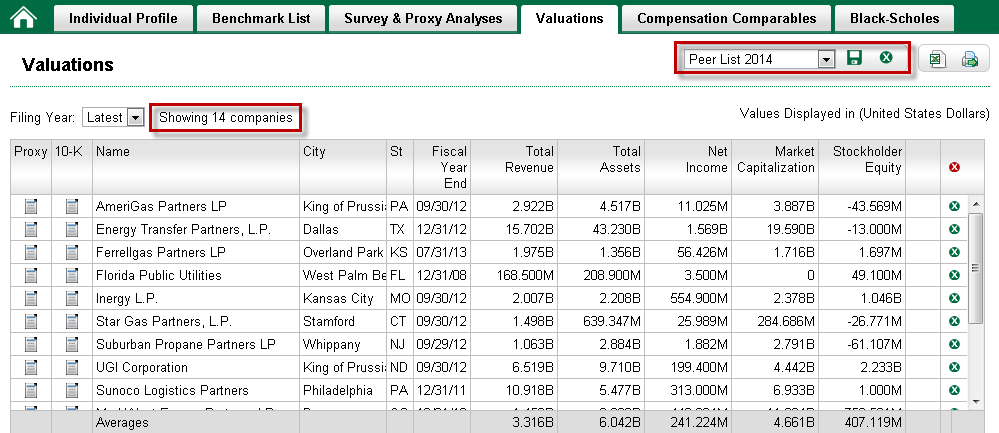
The final results include 14 companies (3 more than last year) for Suburban Propane to evaluate.  Now the user can save the list for future reference, output the results into an MS Excel spreadsheet and conduct any further analysis on over 50 data elements.

To measure performance and ensure relative peer comparisons are relevant, companies invest a lot of time and resources in internal controls to establish processes for these purposes.   ERI’s Executive Compensation Assessor can help companies in meeting their data requirements in this regard.  For more information, contact ERI at 1-800-627-3697 or visit www.erieri.com.


Charity Navigator CEO Compensation Survey Finds 2.5% Increase in 2011

Charity Navigator’s 8th Annual Compensation Survey of nearly 4,000 medium to large-sized charities concluded that the median CEO salary was close to $126,000, and the median increase from 2010 to 2011 was 2.5%.  The report can be downloaded for free here.

The report also breaks down compensation by size, geographic location, and type of organization, but most compensation committees of nonprofits will have to look further for the detailed information needed to set appropriate salaries for their executives.  As usual, the devil is in the details.

Charity Navigator has created a database of Form 990 information on charities receiving a majority of their revenues from the public, a total of about 7,000 organizations (ERI’s database includes information on over 100,000 charities that report compensation each year.).  About 3,000 were dropped from the analysis for various reasons (discussed in the appendix to the report).  So the first issue is which organizations are included.

The second issue is size.  In this study, size is defined by total expenses into small (charities with total expenses between $1 million and $3.5 million), medium (expenses between $3.5 million and $13.5 million), and large (expenses greater than $13.5 million).  About 80% of all US nonprofits have expenses of less than $1 million, so this information will not apply to them.  And it seems that pay for a CEO leading a $15 million organization would be different from that in a $1 billion organization, but both are grouped together as “large.”

Next to be considered is geographic location, as organizations are grouped into regions. While higher CEO pay is reported in the Northeast ($149,523) and Mid-Atlantic ($147,474), the Northeast region includes both New York and Vermont, while Mid-Atlantic includes both West Virginia and Washington, DC, locations with very different pay structures.

And finally, organizations are grouped by mission, but only in broad groups.  If a list of similar organizations is to be constructed, it is necessary to choose from all organizations paying compensation, and then select the comparables by specific size, by geographic location, and by detailed mission.

After years of research, ERI created its Nonprofit Comparables Assessor to allow the use of all the above-mentioned criteria so that all relevant organizations are selected for analysis.  Any revenue level can be selected along with a specific state (or the US national average, if the labor market for an executive would be national in scope) along with a National Taxonomy of Exempt Entities code that reflects the organization’s mission.  This approach meets the IRS requirements for relevancy in setting reasonable compensation.  Unlike surveys that provide tables of salary averages or medians using one criterion at a time or surveys that group sizes and geography too broadly, ERI’s Nonprofit Comparables Assessor allows the detailed selection of multiple criteria that influence compensation. Download the free demonstration version and check it out.

Participate & Save up to 75% off on Our Salary Surveys

ERI Salary Surveys is currently accepting submissions for our compensation surveys. Participate before the end of the year and receive a 75% discount on the results. Need a bit more time to submit your data? Not a problem. The submission window is open until March 31, 2014, and participants remain eligible for a 50% discount.

Participation in ERI Salary Surveys is easy; for-profit and nonprofit compensation and benefits survey submissions are accepted online, via email through an Excel version of the questionnaire, or in the old-fashioned paper and pencil format by mail or fax. Survey questionnaires are available online via each respective survey summary page or by contacting ERI Salary Surveys at [email protected].

What’s Included in the Final Report

Our industry and job function surveys for the U.S. and Canada provide up to three sources of compensation data for more than 100 benchmark positions. Take advantage of the participant discount and add to the validity of the survey by submitting your organization’s data.

Our surveys report the following information for each position (salary data are shown in means, medians, and percentile cuts):

  • Annual Salary
  • Incentive/Variable Pay
  • Total Direct Annual Compensation
  • Job Description
  • Graph with a Trend Line and Data Points
  • Selected Characteristics of the Occupation

Are you an ERI Assessor Series® subscriber? If so, participate in any of our applicable surveys to receive a PDF version of the results for free. Simply submit your data through the online questionnaire via the Platform Library.

Data collection began on October 1, 2013, and ends on March 31, 2014. Survey results will be published in August 2014. All survey participants will receive a complimentary copy of the Executive Summary.

In addition to more than 150 industry and job function surveys, organizations may also participate in our employee benefits surveys to become eligible for a discount.

The Health Care Benefits Benchmarking Survey focuses on employer-provided employee health care benefits. The report serves as a valuable reference for considering plans, changes, and strategies for effective benefits management. Data are reported by organization sector, industry group, geographic region, and organization size. Participation in this survey closes January 31, 2014, and the report will be available April 2014.

The Benefits in Nonprofit Organizations Survey includes information on medical, prescription, and dental costs, and also provides data on life/disability benefits, retirement plan practices, paid leave, and other benefits such as executive perquisites. Data provided in this survey give nonprofit organizations an inexpensive resource to compare current benefit offerings to those of other nonprofit organizations throughout the U.S. Data are reported by organization scope, activity area, geographic region, and organization size. Nonprofit organizations have the opportunity to participate in this survey through March 31, 2014. The full report will be available July 2014.

Chronicle of Philanthropy Reports CEOs of Large Nonprofits Received 3% Increases in 2012

According to The Chronicle of Philanthropy’s annual compensation survey, the 2012 median salary increase for CEOs at the biggest US charities and foundations was 3.1%, compared to 3.8% in 2011.  What has changed is the increasing number of performance-based bonuses and incentives, now reported by one-third of the 313 organizations included in the analysis.  The data set included 118 organizations that reported 2012 data and 195 that reported 2011 data.  There is typically about a two-year lag in availability of data from the Form 990 because of the timing of filing deadlines and extensions, as well as the necessity of form processing.

Some highlights from the survey included:

  • The median compensation in 2012 for all CEOs was close to $418,000. Foundations paid more, with a median of nearly $498,000.
  • Of the 313 large nonprofits, 34 paid their CEOs more than $1 million, compared to 23 in last year’s study.
  • Twenty-two groups in 2012 reported that someone other than the CEO—a chief investment officer, a football coach, or a surgeon—made more money than the chief executive.
  • Of the top 20 highest-paid executives in the large organizations studied, only 2 were women in 2012.

So many more of these large organizations now pay their CEOs more than $1 million – is that an unreasonable salary?  The medians presented in these survey results must be further refined to answer that question, using data from only comparable organizations.  The IRS says that the comparables should be for executives with similar responsibilities in similar organizations.  Sometimes that may even include data from for-profit companies, if the skills needed by the executive could also be found in such companies.   These questions should be asked to determine relevancy for determining comparable organizations: where can the executive with the appropriate background be found and what organizations would compete for that talent (regardless of the sector)?
Setting the “right” nonprofit compensation requires data from relevant comparables, which can be easily assessed in ERI’s Nonprofit Comparables Assessor.  This software uses a database of all the Form 990 compensation data and allows the user to select the relevant characteristics (size of organization, industry or subsector, geographic location) and provides an estimate of what is reasonable compensation using a statistical model.  This is the same tool used by the IRS to identify compensation outliers.  Download a free demonstration version of the Nonprofit Comparables Assessor to see if the CEOs in this report have salaries in line with the market for their skills – or whether they should be expecting some questions from the IRS.

Study Shows Nonprofit CEO Salaries Rose 2% in 2011

GuideStar’s recently released study of compensation at 95,000 nonprofit organizations showed small increases for executives in 2011, averaging 2% for CEOs, barely keeping up with the rate of inflation. Before the 2008 recession, increases averaged 4 to 6%, but had been much lower for the past several years.  GuideStar analyzed the 2011 compensation data of about 135,000 executives in 14 job categories reported on the IRS Form 990 and prepared tables that show median salaries based on organization size, type, and geographic location.

Additional analyses covered the issue of pay differences by gender (GuideStar reviews the names and assigns a gender to those that are typically used for males or females).  The data show that while the number of women executives continues to grow, they are typically paid less than their male counterparts in organizations of all sizes.  More details on differences in compensation between men and women can be found in this Chronicle of Philanthropy article. The gap is shrinking but at a very slow pace.

Some highlights include:

  • The pay gap is largest at organizations with budgets of $5 to $10 million, where women leaders are paid 21 percent less than men. The smallest gap was at groups with budgets of $250,000 or less, where women are paid 9 percent less than men.
  • There were fewer women leaders at the largest organizations; for example, females headed only 16% of the organizations with budgets over $50 million. That percentage is over 50% for organizations with budgets of $1 million or less.
  • Washington, DC’s nonprofit executives had the highest median salary—$152,676—of the top 20 largest urban areas in the report, while Portland, OR had the lowest.
  • Science and technology organizations had the highest median compensation, with leaders of religious organizations at the bottom among the types of organizations analyzed.

Different tables in the report show median compensation by some geographic locations, by budget range, and by broad type of organization.  However, nonprofit boards setting compensation for their top level executives may need much more detailed information to determine what is being paid for similar jobs in similar circumstances.  ERI’s Nonprofit Comparables Assessor allows the user to easily calculate average competitive compensation levels, selecting characteristics that determine pay levels so that the list of comparable organizations can be limited to those that are relevant.  The researcher can choose from a wide array of types of organization (from broad categories to very narrow) and choose a geographic area (from national in scope to zip code) and choose a specific size, not a budget range (and that size can be based on revenue or assets, whichever is most relevant).  This ensures that truly similar organizations are included in the analysis.  Access to the source documents for the data is only a click away so verification is simple.

The analysis provided by the Nonprofit Comparables Assessor is the kind of data that the IRS wants nonprofit boards to use when making compensation decisions.  In fact, the IRS and various state charity regulators use this same software to aid in their determinations of what is reasonable compensation.  Download the free demo version.

IRS Lists Priorities for Nonprofits in 2013-2014

This has been quite a year for the tiny corner of the IRS tasked with overseeing tax exempt organizations. The criticism of the handling of tax-exemption applications for political groups brought more attention to the Exempt Organization (EO) division than the nonprofit sector ever thought possible – and brought down not only the top staff in charge of the division, but also the acting director of the IRS. With the recent publication of the IRS 2013–2014 Priority Guidance Plan, it appears that the efforts to reform the application process for tax exempt organizations are still the highest priority for the EO. 

Overall, the IRS lists 324 projects throughout the entire organization that are priorities for the year (July 2013 to June 2014). These activities will be worked on actively during the year, but with no deadline. The IRS states that important issues include guidance on international taxation and health care, and the implementation of legislative changes, but for the EO division, the list focuses on clarifying the regulations governing 501(c)(4) social welfare organizations and filing requirements for all exempt organizations.For example, this would include guidance on measuring a 501(c)(4) organization’s primary activity and whether it is operated primarily for the promotion of social welfare and/or political campaigns. 

Although compensation reporting was not specifically mentioned in the Plan, the EO sent a strong message in an April report about focusing its compliance efforts on the following issues:

  • Reporting unrelated business income.  If there are multiple years of losses, there may be questions about the activities’ relationship to the organization’s purpose and the allocation of expenses to these activities.
  • Documenting executive compensation decisions.  Appropriate comparability data must be used to set compensation. ERI’s Nonprofit Comparables Assessor gives access to the Forms 990 of similar organizations.  Check out the free demo version.
  • Coordinating reporting on employment tax returns. The IRS runs a check of what’s reported for compensation on Form 990 and employment tax returns, so make sure reporting is consistent.