Tracking Nonprofit Executive Salaries: Recreation/Sports Organizations

The discussion of whether or not the NFL should have nonprofit tax-exempt status is heating up again, as proposed federal legislation that would end such exemptions is considered (see http://ftw.usatoday.com/2014/09/nfl-tax-exempt for a discussion, which is more nuanced than it seems at first glance).  Currently, the NCAA, NHL and PGA Tour do have similar non-profit status, while Major League Baseball gave up its non-profit status in 2007, and the NBA has never been tax-exempt.  Of course, tax-exempt status does not mean that the NFL is considered a charity (serving the public good and accepting tax deductible contributions), just that it is a non-profit trade organization and doesn’t pay corporate income taxes. In fact, the NFL does pay taxes on some of its activities.

But, there are a lot of other nonprofit recreation and sports organizations in the nonprofit sector.  The National Taxonomy of Exempt Entities, the classification system used in nonprofit research and in ERI’s Nonprofit Comparables Assessor, includes Major Group N – Recreation, Sports, Leisure, Athletics (shortened here as Recreation/Sports) as a part of the broader division of Human Services organizations.  These organizations are included in this group:

  • Recreational and Sporting Camps (Day, Overnight, etc.)
  • Physical Fitness/Community Recreational Facilities (parks and playgrounds)
  • Sports Training Facilities
  • Recreational, Pleasure, or Social Clubs
  • Fairs and festivals
  • Amateur Sports Clubs, Leagues
  • Olympics Committees and Related International Competitions
  • Professional Athletic Leagues

This is a category that is wide ranging in size and influence, encompassing the village hunting club and social club as well as some state fairs, the NFL, and the Olympics Committee.   Just computing an average of salaries for this group would be of very limited use to those wishing to set market-based salaries for their executives.

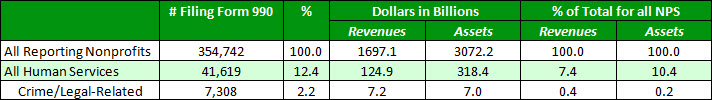
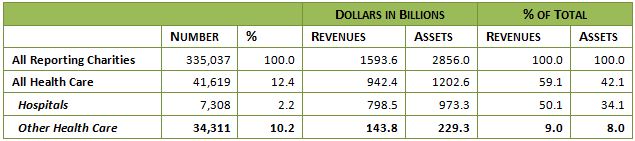
While close to one million nonprofit organizations are registered with the Internal Revenue Service in the United States (see IRS Exempt Organizations Master File, June 2014), only 37% of them have revenues that reach the level of $50,000 and meet the requirement to file a Form 990 each year (with the exception that all private foundations of any revenue or asset size must file a Form 990-PF).  So, out of the almost 355,000 reporting tax-exempt organizations (meeting the revenue requirement for filing a Form 990), about 34% are involved in providing what is defined in the NTEE as Human Services.  Although Human Services is by far the largest NTEE category of reporting nonprofits, Recreation/Sports organizations comprise only 8% of Human Services and less than 2% of all nonprofits.  The table below shows how this group compares in annual revenues and assets to the rest of the nonprofit sector.

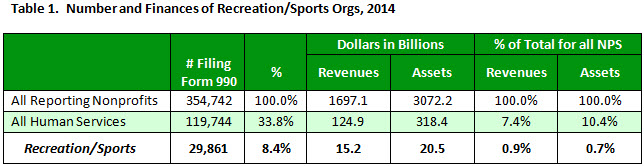
While Human Services organizations are over one-third of the total of reporting nonprofits, their revenues and assets represent a much smaller proportion of the total in the sector, at 7% and 10%, respectively.  This finding is also evident with Recreation/Sports organizations at 8% of the total number of reporting nonprofits, but receiving only 0.9% of total sector revenue and holding only 0.7% of the total sector assets.

The disparities within the group are revealed by looking at the distribution of Recreation/Sports organizations by size, based on the annual revenues reported on their Forms 990.  Of the nearly 30,000 organizations classified as Recreation/Sports, only about 9,000 of them reported paying any compensation at all.  Of those, about 39% had revenues between $100,000 and $500,000, another 17% were in the $500,000 to $1 million range, and another 37% were in the $1 million to $10 million range.  While the compensation of very large organizations are often in the press (for example, the NFL with a Commissioner salary of $44 million), the reality is that almost all of these organizations are very small.  In fact, only around 60 have annual revenues of $50 million.   Thus, when doing salary comparisons for CEOs, it is necessary to use data from similar-sized organizations not averages for the group.

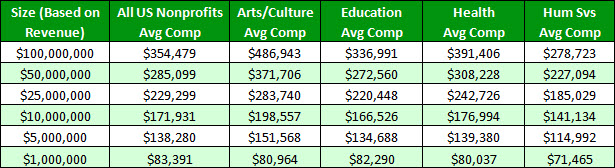
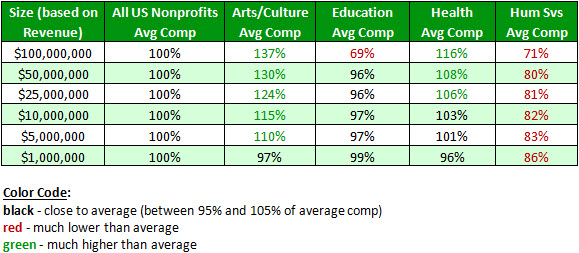
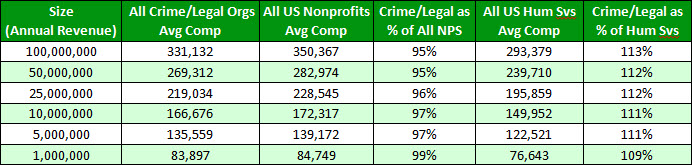
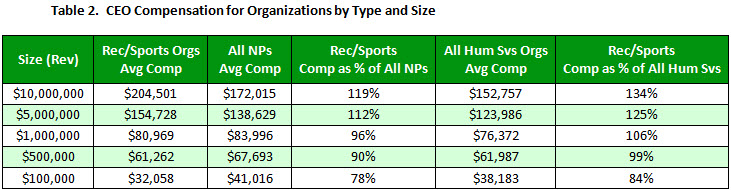
ERI’s Nonprofit Comparables Assessor can be used to calculate average CEO salaries by size and type of nonprofit organization.  The table below compares average CEO compensation for Recreation/Sports organizations with all nonprofits and then with all Human Services organizations.  An interesting pattern emerges —   at the lowest revenue ranges, salaries are lower than for both all nonprofit and Human Services averages, but that quickly changes as the organizations get larger.  At the larger revenue sizes, Recreation/Sports organizations pay more than other nonprofits, especially those in Human Services.  So the smallest ones pay less than other nonprofits, but those relationships change dramatically in larger organizations.

The IRS requires that public charities set executive salary levels looking at compensation data from similar organizations (typically defined as similar in type of service provided, size, and geographic location).  Detailed comparisons using relevant data is clearly needed to ensure compensation levels that comply with IRS regulations.  However, many of the organizations, particularly the larger ones, are classified as tax-exempt under the c6 subsection of the Internal Revenue Code – this means that they are not classified as charities (organized for the public good) and that compensation levels are not subject to IRS penalties.  Their executive compensation must be reported annually on Form 990 and is public information; however, there probably won’t be an IRS investigation of salary levels.  For smaller Recreation/Sports organizations, if they are tax-exempt as public charities (IRC Section 501c3), there is still a need to collect comparable data to set reasonable salaries, in accordance with IRS regulations.

Earn Recertification Credits by Participating in Our Salary Surveys

HR professionals are now eligible to receive recertification credits for WorldatWork Society of Certified Professionals designations by participating in ERI Salary Surveys compensation and benefits surveys.

Each completed survey is eligible for 0.5 recertification credits. A maximum of two surveys from ERI may be used for credit per recertification period. To receive credit, participants may enter their involvement with ERI Salary Surveys through WorldatWork’s online recertification application in the “Leadership Section” under “Non-WorldatWork Survey Credits.”

Participate before the end of the year and receive a 75% discount on the results. Need a bit more time to submit your data? Not a problem. The submission window is open until March 31, 2015, and participants remain eligible for a 50% discount. Survey questionnaires are available online via each respective survey summary page or by contacting ERI Salary Surveys at [email protected].

executive compensation

How to Select and Use Compensation Surveys

This learning aid serves as a resource to select and to use compensation surveys, a foundational element in total rewards management.

Why Use Compensation Surveys?

Compensation surveys are an essential tool for organizations to measure the external labor market. If not developed ‘in-house,’ pay-information surveys conducted elsewhere can be obtained, though participating in a survey may be required.

Given the usage and importance of compensation surveys, the following questions should be addressed when evaluating a survey:

  • What jobs are included?
  • What markets and organizations are covered in the survey?
  • What type of information is collected?

The Market Rate

Employees typically expect to be paid the normal market rate for comparable work, especially as access to online compensation data sources becomes more widespread. Increasing employee engagement over labor market norms makes it more important than ever for Human Resources professionals to be well-versed in compensation survey data.

Organizations determine competitive “market rates” for a job based on the following parameters:

  • Cross-industry geographic area
  • Targeted industry rates within a geographic area
  • Industry rates not considering geographic area

Available Sources

Organizations that need competitive market data have several options, listed from least expensive to most expensive:

  • U.S. government surveys
  • Free online salary websites
  • Compensation surveys from specialty firms
  • Sources providing a census based on wage-survey sources
  • Professional survey or trade association surveys
  • Informal group of employers participating in a survey
  • Sponsor a new survey

Relevant Information

Compensation surveys require a significant quantity of organization-level data for companies to target relevant peers and labor markets, including information concerning these elements:

  • Size (often revenue or number of employees)
  • Location
  • Industry

Comprehensive compensation surveys also require pay-policy information and pay-practice information, allowing for contextual interpretation of compensation data, including the following:

  • General increases
  • Salary structure adjustment
  • Merit increase and promotion or adjustment budgets
  • Number of incumbents in each job
  • Extremes of the salary range
  • Degree of match
  • Actual low salary
  • Actual high salary
  • Hiring rate
  • Incentive or bonus eligibility
  • Premiums
  • Shift differentials
  • Union status
  • Exemption status
  • Education level typically required for the position
  • Certifications typically required

Job Matching and Comparability

The major concern when comparing compensation surveys is whether the job titles and their matching descriptions surveyed adequately mirror each other. Key positions included in surveys, known as benchmark jobs, should meet these requirements:

  • Represent the entirety of relevant jobs
  • Exist in the majority of surveyed firms
  • Be readily definable
  • Have similar descriptions to one another
  • Represent quality reference points (concerning difficulty and responsibility) within the job structure
  • Be widely recognized within the Human Resources community
  • Be positions that at least some organization fill using external sources

Position comparability depends upon the “job match” between benchmark job descriptions used for a survey and an analyst’s knowledge of a similar position’s tasks within his or her organization. As a best-practice guideline, if 70% of the core responsibilities reflected in the job descriptions match, then the two jobs can be considered a match. This entails a position analysis through comparison between a survey participant’s compensation professional and the survey consulting firm, especially for first-time survey participants. Proactively communicate to internal staff who contribute to the job matching process that benchmark job descriptions tend to be more generic, less detailed descriptions than ‘in-house.’

Analyzing Data

Although the process of collecting data through compensation surveys is well-defined, the data analysis can be conducted and/or displayed in a variety of manners.  The first step in analysis is to determine standard error (usually expressed in percentages or in currency amounts), which is the standard deviation of a sampling distribution and measures the reliability of the survey results based on the spread.  Once the standard deviation is known, confidence intervals can also be defined.  (Explanation of the calculations is outside the scope of this document.)

Then, survey results should be summarized in an easily understandable format, such as a graph showing maturity curves or other data visualization approaches that effectively present the information to the targeted audience. The maturity curves represent progress in an occupation and are typically used in salary surveys of professional employees, as shown below:

Professional associations often collect and publish compensation survey results by discipline, degree level, supervisory status, and years since degree. Separate distributions are provided for different degree levels and for supervisors and non-supervisors.

Safe Harbor

In August of 1996, the Department of Justice and the Federal Trade Commission issued Statements of Antitrust Enforcement Policy in which both agencies established basic guidelines ensuring survey constructs do not violate antitrust law (preventing collusion). In response, Safe Harbor guidelines were adopted by many companies, as surveys conducted within Safe Harbor usually are not challenged by the Department of Justice or Federal Trade Commission.

The guidelines, known as the Antitrust Safety Zone, specify the following:

  • A survey must be conducted/managed by a third party
  • Data provided by survey participants must be older than three months
  • At least five organizations must report data for each disseminated statistic
  • No single data source will represent more than 25% of the weighted basis of the statistic
  • Reporting must be aggregated to prevent identification

Conclusion

Identifying, selecting, and analyzing relevant compensation benchmark data requires a diligent process, providing competitive market data for relevant industries, similar jobs, and appropriate labor markets. This learning aid has outlined such an approach.

ERI Economic Research Institute compiles the most robust salary, cost-of-living, and executive compensation survey data available, with current market data for more than 1,000 industry sectors.

ERI’s Assessor Series® – Solutions for every compensation decision

Try a FREE Demo Request a Guided Tour

Pay Raises for Nonprofit CEOs?

It’s autumn, and thoughts of 2015 pay raises are forming in the minds of nonprofit leaders and their boards.  At the least, this seems to be the season of the publications of annual reports about pay raises for nonprofit executives.  Let’s review some of the findings of recent reports and see how helpful they will be for setting executive compensation that will be market-based and in line with IRS regulations.

Here are some key points from The Chronicle of Philanthropy’s annual compensation survey:

  • Big nonprofits and foundations are beginning to finally pay executives more than the inflation rate, with a median increase of 4.9% between 2011 and 2012 (The Chronicle tracks only 82 organizations, the largest charities in the US.).
  • Excluding the 20 groups that cut pay or kept it flat, the remaining 62 organizations in The Chronicle’s survey increased CEO pay 6.8% in 2012.
  • Compensation was more than $2 million for 18 CEOs.

GuideStar’s annual study was also released this week and gives a broader view of increases in the sector, as the research includes data from about 91,000 organizations.  Consider these findings:

  • The median pay increase for top executives at nonprofits was 2.2% in 2012, up from 2% in 2011 and 1.6% in 2010.
  • There is a significant gap between pay in larger and smaller charities, and it appears to be widening. For CEOs in the largest charities, the median increase was about 4% in 2012 (median salary of $444,108), while the average increase for heads of charities with less than $250,000 was approximately 1% (median salary of $44,806).

So what is the “right” increase for 2015?  Using these reports, one could conclude a range between 1% and 7% – of course, the reports are of CEO pay increases between 2011 and 2012.  Obviously, those determining an annual pay raise for a charity executive must do research far beyond reading some averages and medians for the nonprofit sector as a whole or even the groupings available in these reports.

The factors that influence compensation remain the same:  what you do (the job) and where you do it (type, size, and sometimes location of organization).  The data that are needed for comparison must be collected from similar organizations, and what is important to the market is the salary paid, not the rate of increase.  The rate of increase for a CEO in a specific organization should be based on how the current pay aligns with the market rate for the position as determined by the comparable data.  Overall averages and medians always seem to be of great interest but often are a poor basis to determine market rates that follow IRS criteria.

For example, the table below, created using ERI’s Nonprofit Comparables Assessor, illustrates the variation in pay for different sizes and types of nonprofit organizations.  It also shows the danger in applying an average or median increase to a salary to attempt to come up with CEO compensation.

Table 1.  Average Nonprofit CEO Compensation by Type and Size

The differences in average CEO pay among large and small organizations are huge, but the differences among organizations with varying activities and services are also striking.  Obviously, just applying an average or median increase from a survey such as those cited above may not bring about a compensation level based on what is paid by comparable organizations.

To further illustrate, Table 2 shows how average CEO compensation for different types of organizations varies from the all nonprofit average at different sizes.  Again, it is clear that both the factors of type of organization and size influence compensation levels.

Table 2. CEO Compensation for All Nonprofits Compared to Different Types and Sizes

The only way to assess appropriate compensation levels is to look at levels for comparable organizations, using type of organization and the size as major factors.  In some types and sizes, geographic location will also be a factor.  Although this is a much more detailed analysis than reviewing more general national surveys, it is easily accomplished using ERI’s Nonprofit Comparables Assessor.  Nonprofit boards will then be assured that their CEO compensation is competitive and their process is in compliance with IRS standards.


Tracking Nonprofit Executive Salaries: Crime and Legal-Related Organizations

Before addressing either the obvious question, “Does crime pay?” or, more precisely, “What do the CEOs of crime and legal-related nonprofits earn?” let’s take a look at how this type of organization fits within the nonprofit sector in the US.  The National Taxonomy of Exempt Entities, the classification system used in nonprofit research and in ERI’s Nonprofit Comparables Assessor, includes Crime and Legal-Related organizations (Major Group I) as a part of the broader division of Human Services organizations.  More specifically, Major Group I consists of organizations addressing and influencing policy and providing services in areas such as these:

  • Crime prevention, including drunk driving and delinquency;
  • Correctional facilities, such as half-way houses for offenders/ex-offenders;
  • Rehabilitation services for offenders and their families, plus prison alternatives;
  • Court reform and alternatives to litigation and sentencing, such as dispute resolution and mediation services;
  • Protection against and prevention of neglect, abuse, and exploitation; and
  • Legal services, including public interest law and litigation.

According to the Internal Revenue Service statistics, [i] close to one million nonprofit organizations are registered with the Internal Revenue Service in the United States, but only 37% of them have revenues that reach the level of $50,000, which requires the filing of an annual Form 990 (with the exception that all private foundations of any revenue or asset size must file a Form 990-PF).

Of the over 350,000 reporting tax-exempt organizations (meeting the revenue requirement for filing a Form 990), about 34% are involved in providing what is defined by the NTEE as human services.  Although Human Services is by far the largest type of reporting nonprofits, Crime and Legal-Related organizations comprise only 5% of Human Services and less than 2% of all nonprofits.  The table below shows how this major group compares in annual revenues and assets to the rest of the nonprofit sector.

Table 1. Number and Finances of Crime/Legal-Related Organizations, 2014

ERI’s Nonprofit Comparables Assessor can be used to analyze average CEO salaries by size and type of nonprofit organization.  The table below compares compensation of all nonprofits, all Human Services, and Crime/Legal-Related organizations.

Table 2. CEO Compensation for Crime/Legal-Related Organizations by Type and Size

Human Service organizations have lower average CEO compensation compared to all US nonprofits for all revenue levels shown above.  However, the averages for Crime/Legal-Related organizations (included in total Human Services) reveal a different finding.  The average compensation for CEOs in Crime/Legal-Related organizations at all sizes is less than the average in all US nonprofits, but it is greater at all sizes when compared to all Human Services. So crime, in fact, does pay, at least when compared to other Human Services organizations (just not when compared to all nonprofits).

Another factor that typically influences salary levels is geographic location.  The compensation averages for CEOs from the Nonprofit Comparables Assessor show significant differences among different states.  Since many of the nonprofits working to influence national policy are located near Washington, DC (including DC itself, suburban Maryland, and northern Virginia), the compensation data for organizations in this area are combined and shown as DC-MD-VA.  Indeed, salaries seem to be higher for organizations in this area that tend to focus on national policies relating to crime and the legal system, particularly for the largest nonprofits.

Table 3. CEO Compensation for Crime/Legal-Related Organizations by State and Size

The IRS requires that public charities set executive salary levels by looking at compensation data from similar organizations (typically defined as similar in type of service provided, size, and geographic location).  There is clearly a need for detailed comparisons using relevant data to ensure that compensation levels comply with IRS regulations.


[i] Internal Revenue Service, Exempt Organizations Master File (2014, June)

Is There a Cap on Nonprofit Salaries in NYS – or Not?

New York State Governor Andrew Cuomo issued an administrative regulation in May 2012 that set a salary cap on nonprofit contractors that get more than $500,000 and 30 percent of their revenue from the state – they are not allowed to pay more than $199,000 a year in state money toward an executive’s salary.  Some nonprofits that have contracts to provide social services for the state have challenged this rule, and now two judges have come to different conclusions about these executive compensation restrictions.

In April 2014, State Supreme Court Justice Thomas Feinman ruled that that the NYS Health Department “overstepped its authority” in imposing pay caps for top officials at state-supported nonprofits. This was a case pursued by Agencies for Children’s Therapy, an association of 33 groups in New York City and on Long Island that provide early intervention and special education programs.  NYS representatives stated that the verdict would be appealed.

But, on August 11, 2014, in a lawsuit brought by a charity providing home care services under a state-funded contract, Suffolk County Supreme Court Justice Emily Pines came to the opposite conclusion – that the cap falls within officials’ authority “to regulate the financial assistance provided by the state in connection with public health care activities.” She made the additional point that the compensation was not truly capped, because organizations can use other funding sources to pay more than $199,000, if they wish to do so.

A ruling in another lawsuit filed in Albany County by the New York State Health Facilities Association is still pending.

The IRS regulations call for data for comparable nonprofits to be used in salary determinations and mention criteria such as size, location, and type of services provided to define which organizations are comparable.   Executive boards setting salaries must look at appropriate comparable data, but there are no defined salary caps.  The arbitrary salary cap approach does not take into account one of the main criteria for setting salaries – size of the organization.

A look at the salaries of top executives in human services nonprofits reveals that they are often paid more than $199,000, particularly the larger ones.  Included in this count are organizations providing rehabilitation services for criminal offenders, legal services, vocational rehabilitation, employment training,  food and nutrition programs, low income rental housing, homeless shelters, disaster preparedness and relief, recreational sports, youth centers and clubs, as well as the more typical family and children’s services.

Not all of these organizations will be directly affected by the salary cap, because the level of revenue received from state government grants is not available. However, the data do indicate the competitive compensation levels for similar organizations. In particular, the larger organizations may need to tap other revenue sources to enable them to pay market rates for executives. Many will be closely following the various court decisions on the legality of the NYS salary cap.

Tracking Nonprofit Executive Salaries: Medical Organizations Other Than Hospitals

The compensation for executives in the medical field, whether their employers are for-profit or nonprofit tends to be high, according to conventional wisdom.  Yet a closer look at the nonprofit world shows that there are significant differences in pay, depending on the type of health-related activities or services provided.  Taking hospitals out of the mix leads to a more nuanced portrait of compensation in the nonprofit health sector.

The National Taxonomy of Exempt Entities, the classification system used in nonprofit research and in ERI’s Nonprofit Comparables Assessor, divides health organizations into four types:

1) Health General and Rehabilitative (Major Group E)

Including Hospitals and Community Health Systems, Health Maintenance Organizations, Family Planning Centers, Rehabilitative Medical Services, Ambulance, Emergency Medical Transport Services,  Organ and Tissue Banks, Convalescent Facilities, Home Health Care

2) Mental Health, Crisis Intervention (Major Group F)

Including Alcohol, Drug and Substance Abuse, Psychiatric, Mental Health Hospital or Group Home, Hot Line, Crisis Intervention Services, Counseling, Support Groups, Mental Health Disorders

3) Diseases, Disorders, Medical Disciplines (Major Group G)

Including associations, support agencies, and service organizations active in the prevention or treatment of specific diseases or disorders; categories are Birth Defects and Genetic Diseases, Cancer, Diseases of Specific Organs, Nerve, Muscle and Bone Diseases, Allergy Related Diseases, Digestive Diseases, Disorders, Medical Disciplines (Geriatrics, Pediatrics, Surgery)

4) Medical Research (Major Group H)

Including associations, support agencies, and service organizations active in research on specific diseases or disorders; categories are the same as in G above.

While there are close to 1.6 million nonprofit organizations registered with the Internal Revenue Service in the United States, only about 40% of them have revenues that reach the level of $50,000, which requires the filing of an annual Form 990 (an exception – all private foundations of any revenue or asset size must file a Form 990-PF).  Public charities (tax-exempt organizations to which donors can make tax-deductible donations) are a subset of the more than 30 types of tax-exempt organizations and comprise about 80% of the total.

The number of reporting public charities – meeting the revenue requirement for filing a Form 990 – is over 300,000 each year.  About 35% are involved in human services, while the second largest category is education organizations (almost 18%), followed by health organizations (12%). Of these health organizations that are large enough to file Form 990, the vast majority are not hospitals.

According to the annual report on the nonprofit sector prepared by the National Center for Charitable Statistics at the Urban Institute, while hospitals and primary care facilities all health care organization receive 59 percent of the revenues in the entire sector, other health related organizations account for only 9 percent of the total.  The table below is adapted from the 2013 NCCS report and shows that the over 34,000 health organizations account for 9 percent of the total revenues and 8% of the assets.

Table 1.  Number and Finances of Nonprofit Health Organizations, 2011

Using ERI’s Nonprofit Comparables Assessor, the table below illustrates the variation in average CEO salaries by types of health organization (excluding hospitals).

Table 2.  CEO Compensation for Health Organizations by Type and Size (excluding Hospitals)

Mental health organizations clearly have lower salaries, while it appears that the medical research entities, often headed by MDs, are paid higher than heads of the others working in health.  Other factors that typically influence salary levels are size and even geographic location.

The IRS requires that public charities to set executive salary levels looking at compensation data from similar organizations (typically defined as similar in type of service provided, size, geographic location).  Finding closely comparable organizations in health requires a close look at type of services provided and activities, since there is a wide variation among the broad category of all nonprofit health organizations.


Mandatory E-filing for Forms 990 – Now a Lawsuit!

The IRS Forms 990 filed annually by nonprofits can provide valuable information about these organizations, including pay for their executives, fundraising expenses, and names of board members, as well as services offered, and they are available to the public.  The problem is the way that the IRS makes the data available – only in an image format, so that users must type the needed data into a database before any analysis of multiple forms is possible.  Even if the organizations submit their forms electronically, the IRS converts them to images before their release to the public.  Currently watchdog groups and others that provide information on charities, including ERI Economic Research Institute, as well as Charity Navigator, GuideStar, and the Urban Institute, have to spend money and time to manually enter the data they get from the IRS before making it available to the public, even if it has previously been digitized. Talk about digital dark ages!

On June 18, 2014, a federal district judge in San Francisco decided that a lawsuit against the IRS filed by an open-records group could proceed.  The lawsuit was filed when the IRS failed to provide several Forms 990 in a format that can be read by computers (these were forms that were originally submitted electronically to the IRS). Public.Resource.org, a nonprofit which was successful in pushing the Securities and Exchange Commission to post corporate filings free online in the 1990s, among other projects, initiated the lawsuit. While the IRS asked the court to dismiss the suit, arguing that the Freedom of Information Act does not require the agency to provide documents in any specific format and that it would be difficult to create a new system for removing confidential information before releasing machine-readable files, the judge said he had tentatively decided to hear the arguments.  It is possible that there will be a decision by fall 2014.

While electronic filing has been supported by much of the nonprofit sector for years, progress has been slow because of legal and administrative hurdles.  The Obama administration’s last two budgets have proposed making e-filing mandatory and requiring the IRS to release them in machine-readable format for the tax years that follow. While key lawmakers have endorsed the idea, there has been no congressional action.

Currently, charities with at least $10-million in assets, along with all foundations and charitable trusts, must submit forms electronically if they file at least 250 tax returns during the year, such as W-2 forms for their employees. Nonprofits with $50,000 or less in revenue are required to file an electronic postcard (Form 990-N).  All other organizations can choose to file electronically, and about 70 percent of nonprofit returns are still mailed to the IRS in a paper format.  So the IRS has chosen to make all returns, whether filed electronically or not, available to the public as images only.

So while ERI awaits the outcomes of lawsuits and government actions, we continue to digitize Forms 990 so that the compensation data can be used in the Nonprofit Comparables Assessor. Users can easily access and analyze compensation data from comparable organizations (selecting the criteria for size, type, and geographic location).  These data allow nonprofits to set appropriate salaries for their executives and document their decisions for all their stakeholders, as well as regulators.

Nonprofits Continue Shifting Health Care Costs to Employees

As nonprofits aim to attract and retain top talent under a ceiling of salary budget constraints, providing a competitive benefits package becomes increasingly important. The fourteenth annual Benefits in Nonprofit Organizations Survey, released on July 1, 2014, reports that nonprofits are paying approximately 70-75% of the total premium cost of medical coverage, on par with 2013 levels but substantially lower than employer contributions in 2012 (87%). Similar to employers in the private industry, nonprofit organizations appear to be continuing cost saving strategies by shifting more expenses on to the employees.

In addition to a strong focus on medical, prescription, and dental costs, the survey also reports data on life and disability insurance, retirement plan practices, paid leave, and other benefits.  Some highlights include the following:

  • Preferred Provider Organization plans remain the most prevalent type of medical benefits delivery in 2014.
  • At least one dental plan is offered to employees in 95% of responding organizations.
  • Sixty-eight percent of respondents offer vision benefits. Of those organizations, 34% offer vision as part of the medical plan.
  • Ninety-seven percent of responding organizations offer some form of retirement plan to employees.

Questionnaires for the Benefits in Nonprofit Organization Survey were designed and distributed in October 2013. Submissions were collected until March 2014, with an effective date of benefits as of January 1, 2014. Data for 122 medical plans covering over 13,500 employees were reported in the 2014 sample. Eighty-four dental plans were also reported. Data cuts are provided by type of nonprofit organization, organization size (by number of employees), organizational scope, and geographic region. Results may be purchased for $489 via http://salary-surveys.erieri.com.

A companion benefit report published in April 2014, the Health Care Benefits Benchmarking Survey, which includes nonprofit organizations, government entities, and for-profit organizations (private and publicly traded), is also available online through ERI Salary Surveys.

Tracking Nonprofit Executive Salaries: Environmental and Animal Organizations

So how much does the executive director of “Poodles in Peril” or “Save Cripple Creek from the Developers” earn each year? How much should he or she make?  While these are imaginary organizations, groups with similar names asking for donations seem to be everywhere – in the daily mail, highway billboards, television, and print media.  The appeals are numerous, and the accompanying pictures and prose are dramatic and engaging, but how do these types of organizations (categorized as “environment/animal” in the National Taxonomy of Exempt Entities, the classification system used in the nonprofit sector) fit into the nonprofit sector?  How much do their executives make compared to similar-sized nonprofits providing other types of services?

While there are close to 1.6 million nonprofit organizations registered with the Internal Revenue Service in the United States, only about 40% of them have revenues reaching the level of $50,000 that requires the filing of an annual Form 990 (with the exception of private foundations, which must file a Form 990-PF regardless of revenue or asset size).  Public charities (tax-exempt organizations to which donors can make tax-deductible donations) are a subset of the more than 30 types of tax-exempt organizations and comprise about 80% of the total.

The number of reporting public charities – meeting the revenue requirement for filing a Form 990 – is about 300,000 each year.  About 35% are involved in human services, while the second largest category is education organizations (almost 18%), followed by health organizations (12%).

Trailing in both numbers and size are environmental/animal public charities.  There are about 15,000 of them nationwide, but annual revenues total about $15 billion, less than 1% of the total revenues in the nonprofit sector.  While the number of groups has increased over 50% over the past ten years, they still represent less than 5% of the total of public charities and hold less than 1% of the assets in the sector.  See more on the composition of the sector in the annual report prepared by the National Center for Charitable Statistics at the Urban Institute.

When compared to other types of nonprofits, environmental/animal groups tend to pay their executive directors (EDs) on the low side, according to the analysis of Form 990 compensation data from ERI’s Nonprofit Comparables Assessor.  The table below shows the relevant comparisons.

Along with size and type of services provided, another factor that impacts salary levels for EDs is geographic location.  First, annual salaries for EDs of similar-sized environmental/animal organizations are compared for different locations where many might be expected to be located.   Overall, the ED salaries of organizations in these large states and in Washington, DC (perhaps attempting to influence national policy and legislation) are higher than the average salaries throughout the US.

The table below shows salaries in some other geographic locations – and it is significant but variable.

The bottom line – the IRS regulations require that public charities look at compensation data from similar organizations (typically defined as similar in type of service provided, size, geographic location) in the process of setting executive salary levels.  These factors all have significant impacts on what nonprofit executives are paid, as demonstrated above for environmental/animal organizations.