Tracking Nonprofit Executive Salaries: Human Services Organizations

Nonprofits classified as Human Services organizations are typically what the public thinks of when nonprofits are defined. According to the National Taxonomy of Exempt Entities (NTEE), the classification system used in the nonprofit sector (learn more at www.guidestar.org/rxg/help/ntee-codes.aspx), the group includes organizations providing a wide range of services, including Crime and Legal Related; Employment and Job Related; Agriculture, Food, Nutrition; Housing, Shelter; Public Safety, Disaster Preparedness and Relief; Recreation, Sports, Leisure, Athletics; Youth Development; and finally Human Services.

While there are one million nonprofit organizations registered with the Internal Revenue Service in the United States, only about 286,000 were defined as charities (tax-exempt under IRC Section 501c3 and able to receive tax deductible contributions) and had enough revenue to require filing a Form 990, the annual IRS information form.  Out of the 286,000 reporting public charities, 35.5% were classified as Human Services organizations, by far the largest NTEE category of reporting nonprofits. The table below shows how this group compares in annual revenues and assets to the rest of the nonprofit sector.

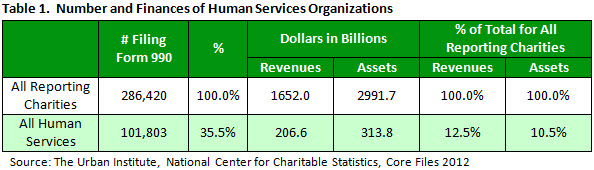
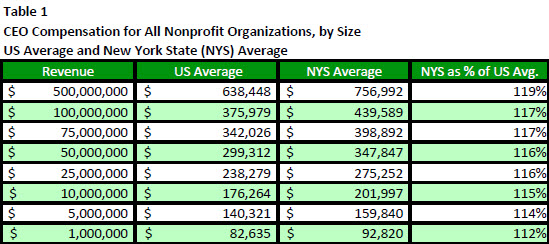
While Human Services organizations are almost 36% of the total of reporting nonprofits, their percentage of revenues (12.5%) and assets (10.5%) represent a much smaller proportion of the total in the sector.  However, these totals mask the wide disparities in size as well as mission among the entities in the Human Services group.  A review of what top jobs (Chief Executive Officer or CEO) pay in these organizations requires a breakout by size and even a more detailed approach on classification.

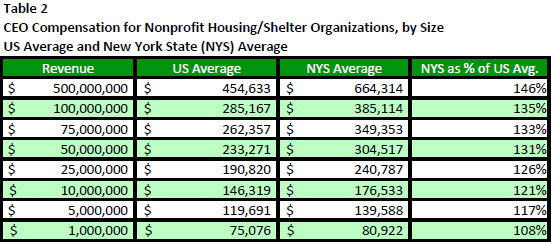
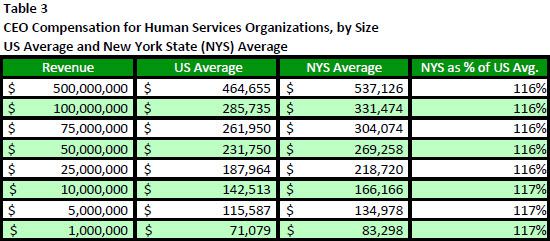
ERI’s Nonprofit Comparables Assessor can be used to calculate average CEO salaries by size and type of nonprofit organization.  The table below compares what the average CEO compensation for all Human Services organizations with $5 million in annual revenues would be and then adds a calculation by subgroup within the Human Services classification.  Recreation and sports organizations of that size are paid an average of 26% more than the average for all Human Services.  What’s more, CEOs of Food, Agriculture and Nutrition charities are paid 82% of the average Human Services CEO.

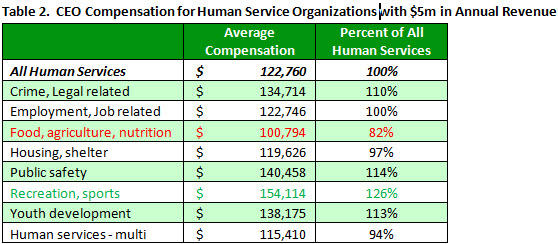
Because of the IRS requirement that public charities set executive salary levels looking at compensation data from similar organizations (typically defined as similar in type of service provided, size, and geographic location), it is necessary to make sure that the data used are actually from comparable organizations.  Obviously a detailed breakout of organizations with similar missions is needed.  Table 2 above does not address the variations in salaries related to different sizes and geographic locations which may also be factors that need to be considered. ERI’s Nonprofit Comparables Assessor allows the user to make selections by detailed classification, revenue size, and geographic location, making the data needed to set compensation easy to access and analyze.

No More Nonprofit Status for the NFL – What Will Change?

A few days ago, the National Football League (NFL) announced that it will be relinquishing its nonprofit status, because “the owners have decided to eliminate the distraction associated with misunderstanding of the league office’s status,” according to Robert McNair, chairman of the league finance committee.  What will actually be the impact of this change?

First, tax-exempt status does not mean that the NFL is considered a charity (serving the public good and accepting tax deductible contributions).  Actually, it is classified as a nonprofit “trade organization” under IRS Code Section 501 c6, a category that also includes business leagues, chambers of commerce, and real estate boards. Currently, the NCAA, NHL, and PGA Tour have nonprofit status as 501 c6s, while Major League Baseball gave up its nonprofit status in 2007, and the NBA and NASCAR have always been for-profit companies.  Tax-exempt status brings the advantage of not paying corporate taxes, along with the disadvantages of public disclosure of finances and executive compensation, plus public confusion about how such a profit-making enterprise could possibly be designated a nonprofit.

The thought of the NFL as a tax-exempt organization is puzzling to most and infuriating to many – recent actions include a congressional proposal to strip the NFL’s nonprofit status and a petition signed by hundreds of thousands of people at Change.org requesting that the league start paying taxes.  While the NFL constantly responded to criticism that its annual revenues of $10 billion were mostly from its member teams, set up as for-profit companies and paying taxes, it was far too fine a nuance for many observers.  The NFL oversees those teams and itself only brings in around $326 million (from 2012).

The bottom line is that, with the loss of nonprofit status, the NFL will probably pay about $10 million in taxes each year.  Comparing annual revenues to the increase in the tax bill, the status change seems a relatively inexpensive way for the NFL to improve public relations.

But the change also means that no more annual IRS Forms 990 will be filed providing compensation information on the top executives.  The NFL’s most recent Form 990 revealed that Commissioner Goodell received $44 million, six other executives drew seven-figure salaries, and 298 employees made $100,000 or more in 2013, numbers that raised eyebrows for an organization not paying taxes.  So why is the IRS not questioning these salaries?  The answer is that the IRS requires that organizations exempt under 501 c3 (charities) and 501 c4 (advocacy) must set executive salary levels looking at compensation data from similar organizations (typically defined as similar in type of service provided, size, and geographic location).  But organizations classified as tax-exempt under 501 c6 are not covered by the regulations on unreasonable compensation (see http://www.erieri.com/Blog/post/2014/10/27/Tracking-Nonprofit-Executive-Salaries-RecreationSports-Organizations for more details).  The only requirement is that compensation must be reported annually on Form 990; but this compensation is determined by the board of each organization.  And, from now on, there will be no information about what the NFL pays its executives.

Even if the NFL starts paying taxes, concerns remain about other tax breaks it receives, such as taxpayer dollars for stadiums and tax breaks on bonds used to finance stadiums.  And, of course, companies that buy luxury suites, tickets, naming rights, and other sponsorships get hundreds of millions more in tax write-offs for business expenses every year.

To summarize, the NFL’s action to become for-profit means paying over $10 million in taxes, perhaps a small cost to pay for ending disclosure of salaries for top executives and criticism of tax-exempt status for a $10 billion company.  As the league deals with concussion settlements and domestic abuse scandals, this may be its best strategic play.

Factors Affecting Nonprofit Executive Compensation

Because of changes in the nonprofit sector in the last few decades, researchers Peter Frumkin, PhD, and Elizabeth K. Keating, CPA, PhD, looked at the relationship between compensation levels and certain characteristics of organizations.  Their article, entitled “What Drives Nonprofit Executive Compensation?,” is available at the Nonprofit Quarterly and should be of interest to ERI’s Nonprofit Comparables Assessor subscribers and those interested in nonprofit executive compensation.

Some nonprofits have reacted to pressure to compensate “more like for-profit companies” by adding variable components to their salaries based on meeting fundraising or program goals or reducing costs.  Often, such goals focus on financial measures rather than social outcomes related to the mission of the organization, so use of variable compensation has been very slow to happen in the sector.  Recent years have brought more for-profit competition in the provision of services typically provided by nonprofits, and some have sought pay comparable to business managers.  But, an even greater influence on pay determination has been the IRS regulations (fully implemented in 2002) that require the use of comparisons to set nonprofit pay to avoid possible sanctions and fines.

The authors conclude that base pay in most nonprofits increases in direct proportion to the size of the organization.  While not a surprising finding, it confirms ERI’s approach to providing documentation that is both relevant to the market rates for these executive jobs, but also acceptable to the IRS.  ERI’s Nonprofit Comparables Assessor (CA) uses size as a criterion for selecting comparable organizations for salary determination, but also allows the user to add the type of organization and geographic location.  The analysis below using CA explores how just using size may lead to inaccurate results that might not be acceptable to the IRS.

Table 1 illustrates the relationship between average salaries of CEOs and size of organization, as measured by annual revenues.  As size increases, compensation also increases.  But. a look at the salaries for all nonprofits in the US compared to those just in New York State (NYS) shows that geography also has an influence on salary levels.  That influence actually varies based on the size of the organization.  The differential between average US and NYS salaries increases with the size of the organization, from 112% for all nonprofits with $1 million in annual revenues to 119% for those with $500 million.

Tables 2 and 3 show that the type of organization is another factor that has an influence on salary levels, using CEO average salaries in the US and NYS.  Looking at Housing/Shelter nonprofits by size, Table 2 again shows that salaries increase with the size of the organization; but, they are also influenced by geographic location and by type of organization.  While the differences between the US and the NYS average salaries for the Housing/Shelter subsector still increase with the size of the organization, the differences range from 108% for the smallest to 146% for the biggest.

Next, the same comparison is made for another type of nonprofit organization, Human Services, as shown in Table 3.  CEOs of NYS Human Services organizations are paid more than the average in the US, but Human Services nonprofits show a different pattern than other types of organizations with an increase in size. For example, when looking at average compensation in NYS as a percentage of the US average for organizations with $500 million in revenues, we see 119% for all nonprofits of that size, 146% for all Housing/Shelter organizations, and 116% for all Human Services organizations.  For the organizations with $1 million in revenues, the respective numbers are 112% for all nonprofits, 108% tor Housing/Shelter, and 117% for all Human Services organizations.

What this analysis reveals is that just reviewing data from similarly sized nonprofits will not provide a good basis for salary determination.  Although size is a major influence, it is clear that geographic location and type of organization are also key factors when nonprofits seek to set their executive pay at levels that are both market driven and in compliance with IRS regulations.

Employers Eyeing Health Care Benefits in 2015

As employers across all industries aim to draw in and retain top performers in 2015, providing an attractive health care plan continues to be a crucial aspect of benefits management. At the same time, employers are also facing new challenges mandated by legislation while trying to keep a lid on the cost growth of benefits. Benchmarking health plan costs and practices with other employers in the external marketplace is the first step in evaluating the effectiveness of current strategies or potential changes.

The 2015 Health Care Benefits Benchmarking Survey, released April 2, 2015, reports on data submissions from 101 employers representing 70,113 employees. Data are reported for 225 medical plans and 119 dental plans in the U.S. The information provides employers with a baseline of current health care plan costs and practices that may be used to make informed decisions regarding benefits management.

This year’s participants reported using the following cost-saving measures:

  • 56% increased employee contribution to premium
  • 29% increased prescription co-payment or coinsurance amounts
  • 29% increased medical co-payment or coinsurance amounts
  • 30% increased deductible amounts
  • 24% increased out-of-pocket maximum amounts
  • 15% changed the drug formulary
  • 18% moved to self-insurance

In addition to detailed medical, dental, and vision benefits information by size and type of employer and geographic location, the survey also reports on the length of employment requirements for coverage and cost-management strategies (such as disease management, health promotion, and wellness programs).

Questionnaires were designed and distributed for this eighth edition of the Health Care Benefits Benchmarking Survey in October 2014. Participation was solicited from employers in the public, private, and nonprofit sectors, as well as government entities in the U.S. Data input was collected in the period from October 1, 2014, to February 15, 2015. The requested effective date of benefits data was January 1, 2015. The survey is available online for $489 via http://salary-surveys.erieri.com. For more information, contact ERI Salary Surveys at [email protected] or 877-210-6563.

For those interested specifically in nonprofit organizations, the 2015 Benefits in Nonprofit Organizations, 15th Edition, will be released by ERI Salary Surveys in July 2015.

Salary Survey Participation Deadline Extended to April 17!

There’s still time to participate in ERI Salary Surveys collection of industry and job function compensation surveys for the United States and Canada. We are extending the submission deadline to April 17, 2015 on our compensation surveys as well as the Benefits in Nonprofit Organizations report. Survey participants receive a complimentary copy of the survey’s Executive Summary and a 50% discount on the purchase of the full survey results.

ERI Assessor subscribers are encouraged to participate in any applicable survey to receive the results for free (PDF version). Survey questionnaires may be accessed through the Platform Library. Participant discounts do not apply to Assessor subscriptions. By participating in our compensation surveys, you not only strengthen the data in the surveys, but also contribute to the quality of our Assessor Series data sets.

PARTICIPATE & SAVE!


Submissions are accepted online, via email through an Excel version of the questionnaire, or in the old-fashioned paper and pencil format sent by mail or fax. For more information or to request participation materials, visit http://salary-surveys.erieri.com/ or give us a call at 877-210-6563.

Executive Compensation for Charity Executives: What IRS Wants

IRS regulations require that charities not give any benefit to an organization insider other than in the form of reasonable compensation.  So, after an “organization insider” is defined, the discussion begins about what is “reasonable” and what is “compensation.”

The IRS has written extensively on what is included in compensation – basically encompassing what is captured on the employee’s W-2 filing for income tax purposes, but there are many more details and examples in the Form 990 instructions and the form itself.  And regulations on what is reasonable have not changed for years – it is determined by comparing the compensation for the executive in the organization of interest to what would ordinarily be paid for like services by a like enterprise under like circumstances. This analysis is completed on a case-by-case basis.

While often nonprofits seem to pay less than for-profit counterparts where they exist, this is not a given.  When collecting comparable data, there is no requirement that all data come from nonprofit organizations.  However, the IRS has stated that, while some comparisons can come from the for-profit sector, nonprofit comparables should always be included.  The goal is to find similarly situated individuals, and they may come from all relevant sectors.

The IRS has provided a “safe harbor” process because of the subjective nature of the analysis required.  If an organization follows this process, then there will be an assumption that the compensation is reasonable – the burden of proof that compensation is not reasonable moves to the IRS (called a “rebuttable presumption”).  The process includes the following general steps (but beware – there are lots of details, so check with a lawyer or Form 990 expert):

  • Compensation must be approved in advance by a disinterested board of trustees/directors.
  • The board must rely on comparability data from other organizations, which may be nonprofit as well as for-profit organizations. For charities with less than $1 million in gross receipts, data from at least three other organizations are needed. The IRS has only stated that “more” comparables are needed for larger organizations.
  • The board must document the basis for its determination of compensation.

Although there is much talk about nonprofit salaries that seem excessive, the circumstances actually determine what is reasonable. So board members must collect data and use them as the basis for setting compensation.  Even if compensation is clearly reasonable, the organization must be certain to properly document its compensation.  The Form 990 compensation data is a valuable source of data for this process, and ERI’s Nonprofit Comparables Assessor allows the user to easily analyze what compensation is for comparable executives in similar organizations and access the actual Forms 990 for more detailed comparisons.  The data are just what the IRS wants to see, and, in fact, the IRS and state charity regulators use this software for their analyses of what is reasonable.

More Steps toward E-filing of Form 990

Three recent developments signal progress in the move toward electronic filing of the Form 990, the annual IRS reporting form required from nonprofit organizations.  Whether these will be enough to actually get an e-filing requirement enacted is anyone’s guess.

#1 – Proposed in the 2016 Federal Budget

The 2016 Federal Budget released by President Obama again included a proposal for mandatory electronic filing of the Form 990.  If enacted, the IRS would also be required to release 990 data in an open, computable format.  Currently, IRS provides only .TIF images which provide only a picture of the form – the data can only be used for analysis by manually entering the data into a database.  This is expensive and time-consuming, delaying access to usable data and increasing the potential for transcription errors.

#2 – Disclosure of E-Filed Data Mandated by Federal Court

Since some Forms 990 are already e-filed, an open government data advocacy group (Public.Resource.org), requested forms for nine organizations that did file electronic data under the Freedom of Information Act.  When the request to IRS for the machine-readable data was denied, the group sued the IRS, and now a federal district judge has ordered the IRS to release the electronic 990 data within 60 days. The IRS can file an appeal of the judge’s ruling within the same 60-day period.  So, stay tuned for further legal developments.

#3 – Recommended by GAO

The Government Accountability Office (GAO) recommended that Congress expand the mandate for electronic filing of nonprofit tax forms. The December GAO report, “TAX-EXEMPT ORGANIZATIONS: Better Compliance Indicators and Data, and More Collaboration with State Regulators Would Strengthen Oversight of Charitable Organizations” (see http://www.gao.gov/assets/670/667595.pdf), concluded that expanded e-filing would result in more accurate and complete data becoming available in a timelier manner, which, in turn, would allow the IRS to more easily identify areas of non-compliance.

These developments follow the inclusion of a requirement for open Form 990 data in the December 2014 tax reform discussion drafts from both the House – by Rep. Dave Camp (R-Michigan), former chair of the House Ways and Means Committee – and the Senate — by Senator Max Baucus (D-Montana), former chair of the Senate Finance Committee.

So, this push for Form 990 e-filing movement has bi-partisan legislative support and support from the executive branch, as evident in President Obama’s budget proposal, and the GAO recommendation which was supported by the IRS.  The nonprofit sector itself has been on record as supporting e-filing for years.  Now there is even a federal court ruling that the electronically filed should be available to the public.  The requirement of e-filing and subsequent release of machine-readable 990 data on a large scale is long overdue.  Is it time at last for the needed legislative action?

Deadline Extended for the Health Care Benefits Survey

There’s Still Time to Participate

Don’t miss out on contributing to ERI Salary Surveys’ eighth annual Health Care Benefits Benchmarking Survey. Participants save 50% off the results! We’ve extended the deadline to accommodate even more employers in the public, private, and nonprofit sectors, as well as government entities in the United States.

Save 50% Off

A 50% discount is available to organizations that participate before February 13, 2015. Participate now and pay later. Your submission locks in the participation discount for when you’re ready to purchase. The survey covers the following details:

  • Eligibility Requirements
  • General Features of Medical Coverage
  • Types of Medical Plans Offered
  • Opt-Out Provisions
  • Co-Payments and Coinsurance Amounts
  • Employer and Employee Medical Plan Costs
  • Prescription Drug Plan Co-Payments
  • Cost-Saving Measures
  • Types of Dental Plans Offered
  • Employer and Employee Dental Plan Costs
  •  Vision Benefits

Benefits in Nonprofit Organizations Survey

Additionally, ERI Salary Surveys sponsors a companion benefit report for nonprofit organizations, covering health care insurance, general benefit practices, disability insurance, retirement plan practices, paid leave, and executive perquisites. Participate before March 31, 2015, to receive a 50% discount off the final report. Participate in the Benefits in Nonprofit Organizations Survey

Are you an ERI Assessor Series® subscriber? If so, participate in any of our applicable surveys to receive a PDF version of the results for free.

Data collection began on October 1, 2014, and ends on February 13, 2015, for the Health Care Benefits Benchmarking Survey and ends on March 31, 2015, for the Benefits in Nonprofit Organizations Survey. Survey results will be published in April 2015 (Health Care Benefits) and July 2015 (Benefits in Nonprofits.) All survey participants will receive a complimentary copy of the Executive Summary. Participation discounts do not apply to Assessor subscriptions. For more information or to request participation materials, please visit www.salary-surveys.erieri.com or call 1-877-210-6563.

Report on IRS Investigations of Charities

Although the title of the Government Accountability Office (GAO) report released in December 2014  TAX-EXEMPT ORGANIZATIONS: Better Compliance Indicators and Data, and More Collaboration with State Regulators Would Strengthen Oversight of Charitable Organizationswill not win any awards for elegance, its 66 pages do provide some interesting insights on the IRS review of charities using the Form 990 data.

The Exempt Organization (EO) division of the IRS initiated 8,413 exams of tax-exempt organization returns in 2013, including 4,495 (about 53%) of charities, exempt under IRC Section 501c3.

Most of these organizations were chosen for a review because of the following:

  • An IRS National Research Program project on employment taxes (41%)
  • Form 990 data analytics (22%)
  • Referrals (including news items) received by EO from internal and external sources alleging potential noncompliance with the tax law (14%)

When the IRS redesigned the Form 990 in 2008, the purpose was to promote compliance and increase transparency. Using the new form, a team of EO specialists developed data-mining queries to identify suspected inaccuracies or anomalies.  Also, with the redesign, the Form 990 compensation reporting period was coordinated with other federal reporting periods so that what was reported to different agencies could be cross-checked for consistency, hence the ability to check the payment of employment taxes.

That said, the IRS examines only a small percentage of charitable organizations that file returns. The examination rate was about 0.7% in 2013, compared to 1% for individual and 1.4% for corporate tax returns. From fiscal year 2011 to 2013, the EO exam rate decreased by about 12%, from 0.81% to 0.71%.

Over the past several years, as IRS budget has declined, the number of full-time equivalents (FTEs) within EO has fallen, leading to a steady decrease in the number of charitable organizations examined.

But, even with decreased staff, increasing use of technology will make it easier to target organizations for an examination.  GAO is recommending that Congress expand the mandate for charities to electronically file their tax returns, and IRS agreed with GAO’s recommendations.  The expectation is that expanded e-filing will result in more accurate and complete data available in a timely manner, also allowing IRS to more easily identify areas of noncompliance.  Now further action on e-filing is up to Congress.

In the meantime, charities are likely to avoid investigations if they follow these guidelines:

  • Set executive compensation according to IRS requirements, using data from comparable organizations.
  • Make sure that what is reported in compensation on Form 990 matches what is reported to other federal agencies.
  • Correctly report and transmit income taxes and other payments related to employees, such as Social Security and unemployment compensation (if required).
  • File the Form 990 completely, accurately, and on time.  Also, e-file to eliminate the most common mistakes the software will not allow math errors, omitting attachments or  required schedules, or failing to sign the return.

Last Month for 75% Participation Discount on Salary & Benefits Surveys

The early bird 75% participation discount for ERI Salary Surveys expires this month. Submit your organization’s pay data before December 31, 2014 to become eligible for the full discount.

Our industry and job function compensation surveys report annual salary and incentive pay data from up to three survey sources. Full job descriptions and a graph with a trend line and data points are also included for each benchmark title. See why HR and compensation professionals trust ERI Salary Surveys for accurate, employer-provided pay data. Submit your data and save!

In addition to our industry and job function compensation surveys, ERI Salary Surveys offers two benefits surveys: the Health Care Benefits Benchmarking Survey and the Benefits in Nonprofit Organizations survey. These benefits surveys were designed to assist organizations in benchmarking health plan costs and practices with other employers in the external marketplace in order to evaluate the effectiveness of current strategies or potential changes. Participate before the end of the month to lock in the 75% discount.