Organizations are leveraging internal and external datasets, such as ERI’s Salary Assessor, to generate analytics upon which they can make smarter business decisions. The effective design of robust analytics can be based on time series regression analysis. This generally is the result of iterative analytics that lead to identifying meaningful independent variables. These independent variables help to predict with some reasonable certainty a probable outcome.
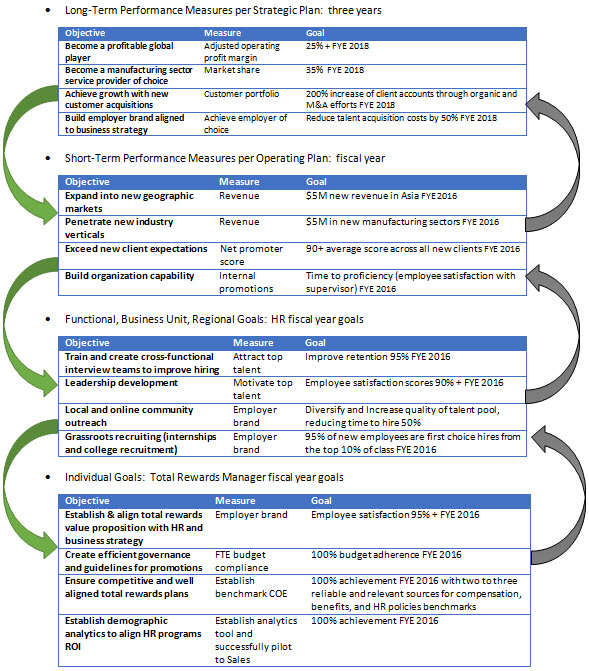
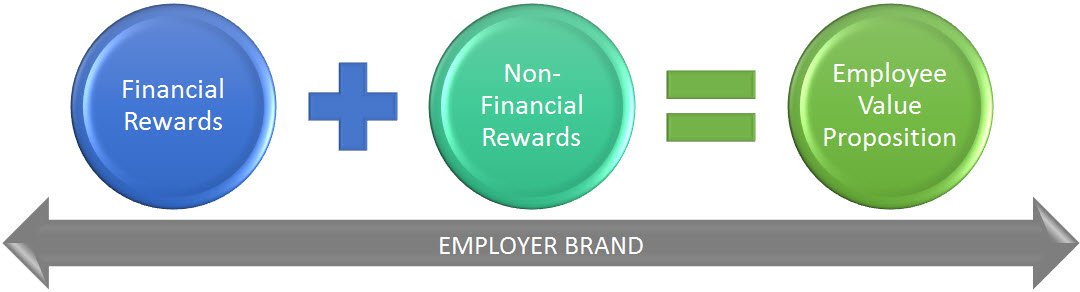
As HR, compensation, and total rewards leaders, establishing an employer brand that effectively communicates a winning employee value proposition that includes both financial and non-financial rewards is one of the most important objectives. Getting the financial part of the equation right requires an economically sustainable and cohesive philosophy based on a long-term strategy.
To get the compensation financial element right, start by defining how you want to compete in the external market place and collecting relevant compensation data. This may be accomplished by surveying your competitors’ pay levels at a single point in time and using the resultant descriptive statistics as input or by purchasing salary survey data. Traditional compensation survey benchmarks are actual data points and calculations of simple averages, percentiles, and counts, which have been normalized to a common date.
Today, organizations that integrate compensation analytics into the decision making process generally have a balanced framework that reflects short-term and long-term planning needs. To support business planning cycles, organizations use compensation structures and labor cost estimates based on data from a single time period benchmark with a smaller sample size, as well as an analytics benchmark with a larger sample size that reflects data collected from thousands of available salary surveys, representing the movement of pay levels over time. At ERI, the compensation analytics benchmark is calculated with time series regression analysis, integrating ERI’s historical datasets with most recent datasets. The regression equations applied can be linear, quadratic, cubic spline, and polynomial cubic spline.
Let’s take a look at both types of benchmarks for Chemical Operator based on 1) quarterly updated ERI Assessor Databases and 2) the annual Survey Participant Database (March 2015 effective date):
| # of Incumbent | 10th | 25th | Median | Mean | 75th | 90th | |
|---|---|---|---|---|---|---|---|
| ERI Assesssor Databases | |||||||
| Annual Salary | $41,803.00 | $45,261.00 | $49,180.00 | $49,923.00 | $54,275.00 | $58,770.00 | |
| Incentive / Variable Pay | $748.00 | $803.00 | $880.00 | $889.00 | $971.00 | $1,052.00 | |
| Total Direct Annual Compensation | 4,515 to 4,819 | $42,551.00 | $46,070.00 | $50,060.00 | $50,812.00 | $55,246.00 | $59,882.00 |
| Survey Participant Databases | |||||||
| Annual Salary | $35,266.00 | $47,833.00 | $61,000.00 | $59,446.00 | $67,566.00 | $73,882.00 | |
| Incentive / Variable Pay | $1,721.00 | $2,193.00 | $2,207.00 | $2,429.00 | |||
| Total Direct Annual Compensation | 1,243 | $35,266.00 | $49,604.00 | $63,193.00 | $61,871.00 | $69,995.00 | $73,882.00 |
As a business leader, you want to give appropriate weight to the scale of the data. In the above example, the Survey Participant Database has 1,243 incumbents, while the ERI Assessor Database has 4,515 to 4,819 incumbents (read “A Comparision of Salary Assessor and ERI Salary Survey Data” for context on the reporting a range of incumbents). Your compensation survey partner should also provide some insight as to why the Survey Database is 20% higher (e.g., perhaps one of the global players is “buying” talent in the market in order to establish new operations in a new location).
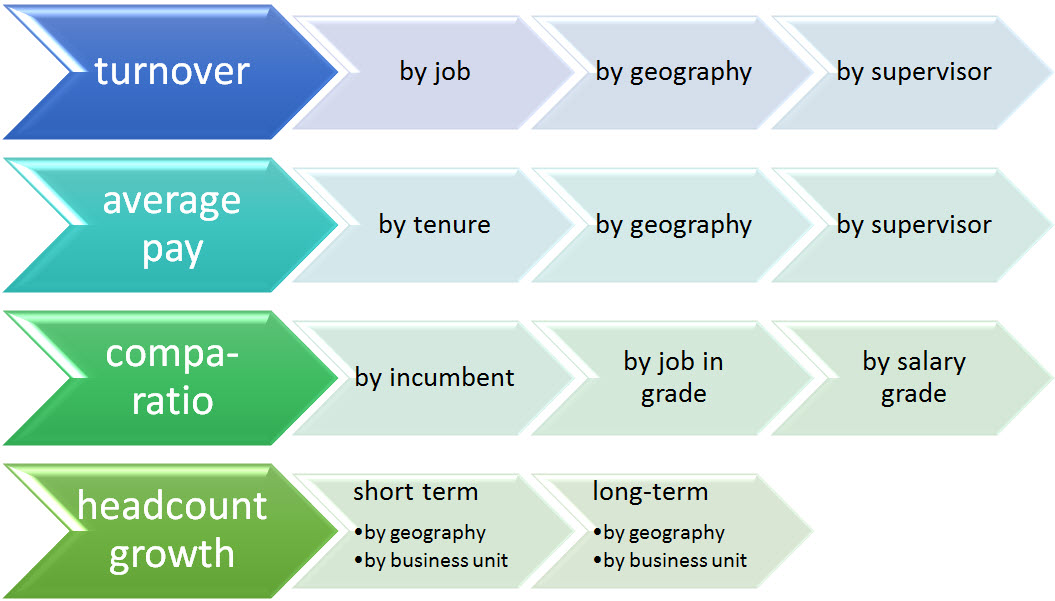
Next, evaluate the internal factors. Apply a consistent, robust business decision-making framework that includes analytics and current descriptive statistics. The internal factors which should be considered include the following:
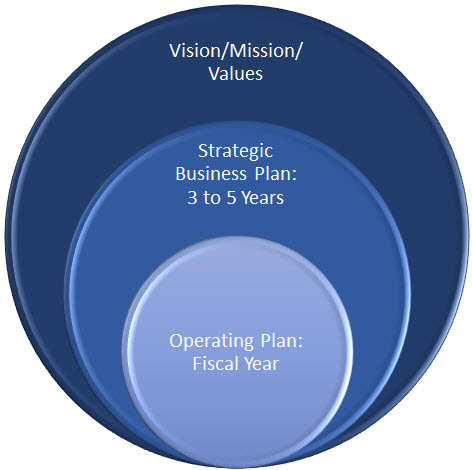
Well managed organizations will have both short-term and long-term strategic plans with corresponding forecasts. As HR, compensation, and total rewards leaders, you want to effectively align your decision making framework to the business planning cycles. Having compensation structures designed and managed using information that reflects current market conditions and time-series regression will prove to be invaluable. Basing a significant fixed cost strategy on a larger sample size which reflects the movement of pay over time while still understanding the current landscape may be more competitive for particular jobs, geographic areas, and industry sectors.
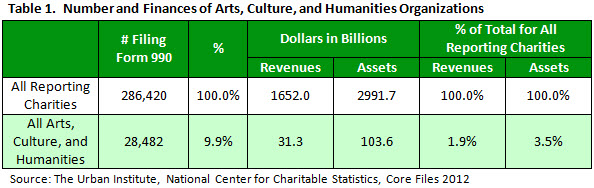
ERI Economic Research Institute compiles the most robust salary, cost-of-living, and executive compensation survey data available, with current market data for more than 1,000 industry sectors.
ERI’s Assessor Series® – Solutions for every compensation decision