remote workers

Compensation Benchmarking for Remote Workers and Shared Services

Global human resources and total rewards professionals provide business insight for geographic labor market differentials that impact their business operations.  Now you can expand your arsenal of benchmarking tools to include geographic labor differentials for 60 cities across Ireland, Finland, and Switzerland.

Number of cities per country

Many organizations compete in the global “war for talent” by hiring employees that may work remotely from anywhere, like their homes, a college dorm rooms, or as contingent workforce partners also in remote locations.  Part of being successful in the competition for talent is to do it cost effectively.

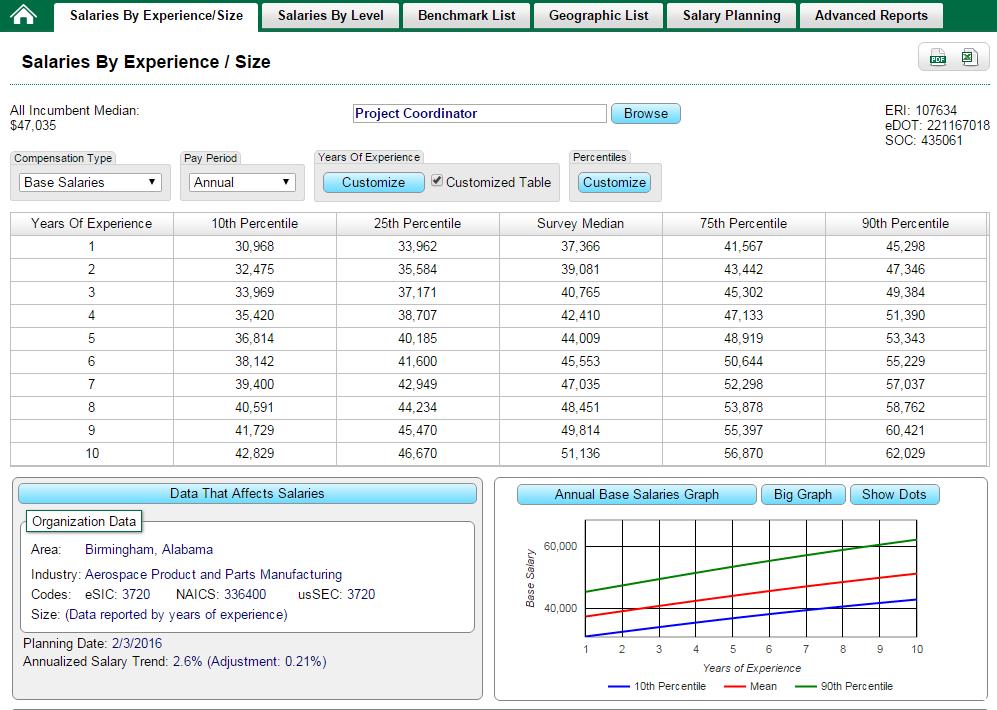
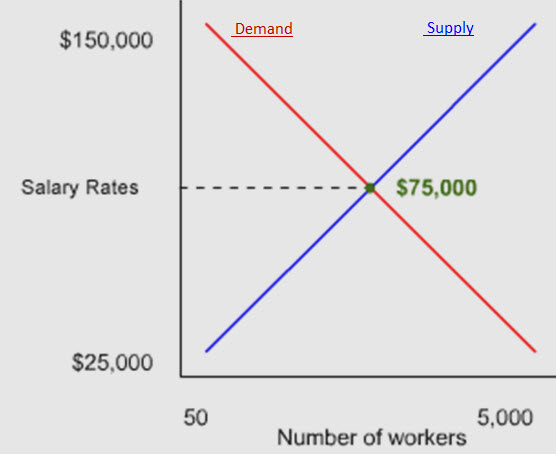
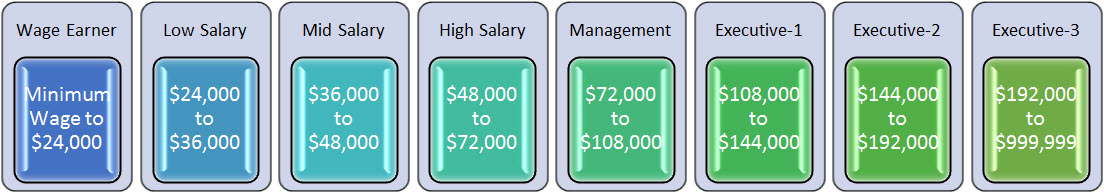
Here’s how geographic labor market differentials help.  For example, you have corporate offices in Helsinki, Finland and found a great candidate who lives in Joensuu, Finland.  Understanding the cost implications of these two work locations both from a cost-of-labor perspective for the company and cost-of-living perspective for the prospective employee is very meaningful.  The compensation analytics below explain the scenario.

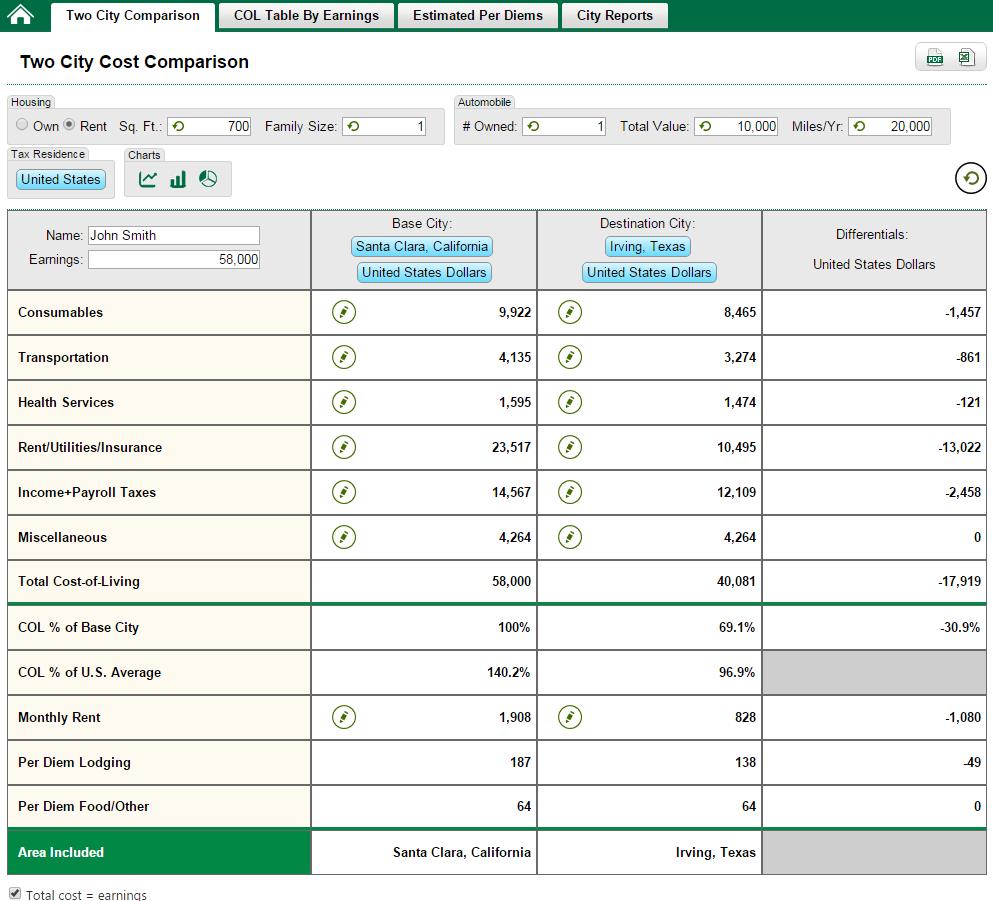
Image #1:  ERI’s Geographic Assessor (GA) – Two City Comparison

ERI's Geographic Assessor (GA) – Two City Comparison

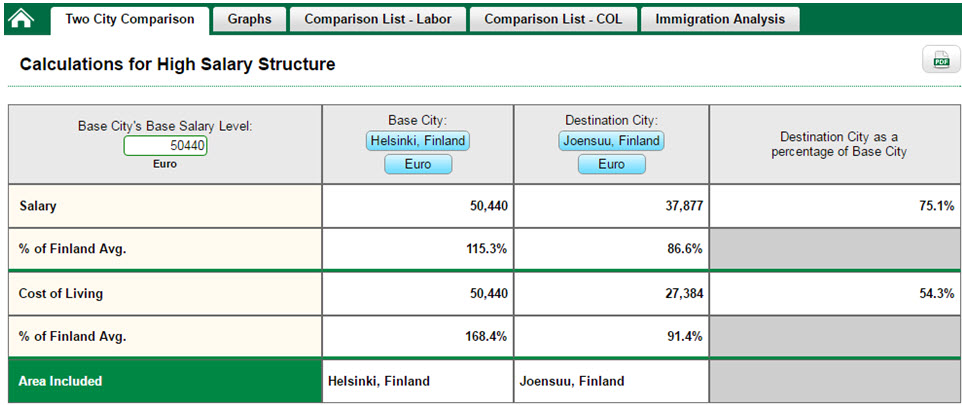
Based on this information, labor market costs in Joensuu, Finland are almost 24.9% lower than in Helsinki, and the cost of living is 55.7% lower in Joensuu.  For this candidate to move to Helsinki and maintain the same standard of living can be an expensive proposition for the candidate.  It will also be an uphill battle for the company to convince the candidate to move to Helsinki.  Alternatively, a win-win outcome would be to allow the this employee to work from home and make accessible the necessary technology to be connected with his or her work teams.  Most organizations will have a business philosophy and formal policy to support the effectiveness of a workforce strategy that include remote workers.  Costs efficiencies are one of the critical inputs.

Insight into geographic labor market differentials is also used when organizations restructure to setup centers of excellence with shares services.   Organizations look to more effectively run their business operations by centralizing specific functions in targeted geographic locations.  For example, many of the enabling support functions, like IT, finance, or human resources, will set up shared services centers to respond to business needs.

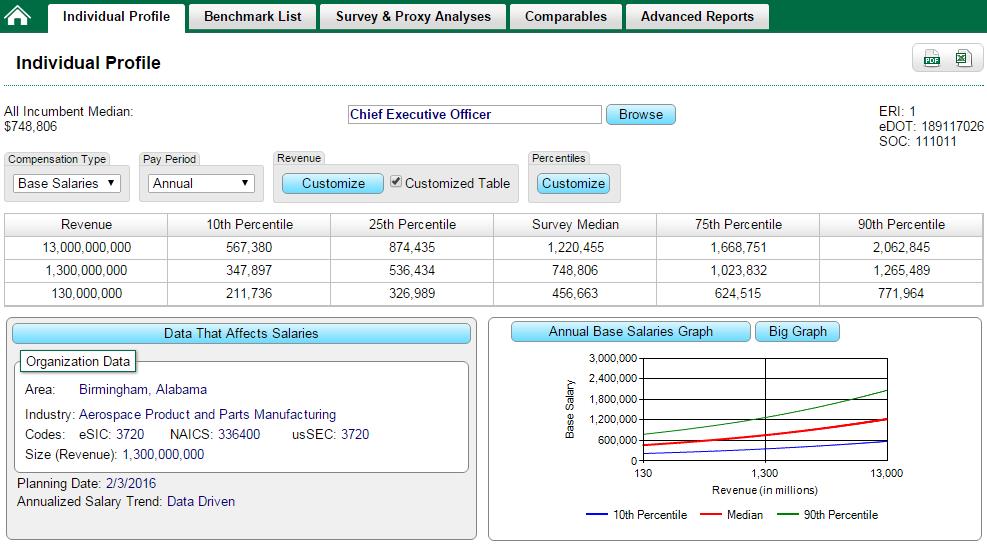
For example, a business scenario with a company headquartered in Dublin, Ireland wants to set up a human resources shared services center.   They want to have a new location outside of Dublin within reasonable distance and have identified Carlow, Ireland as a target location.  Understanding the geographic labor market difference between Dublin and Carlow will provide insight into this business decision.

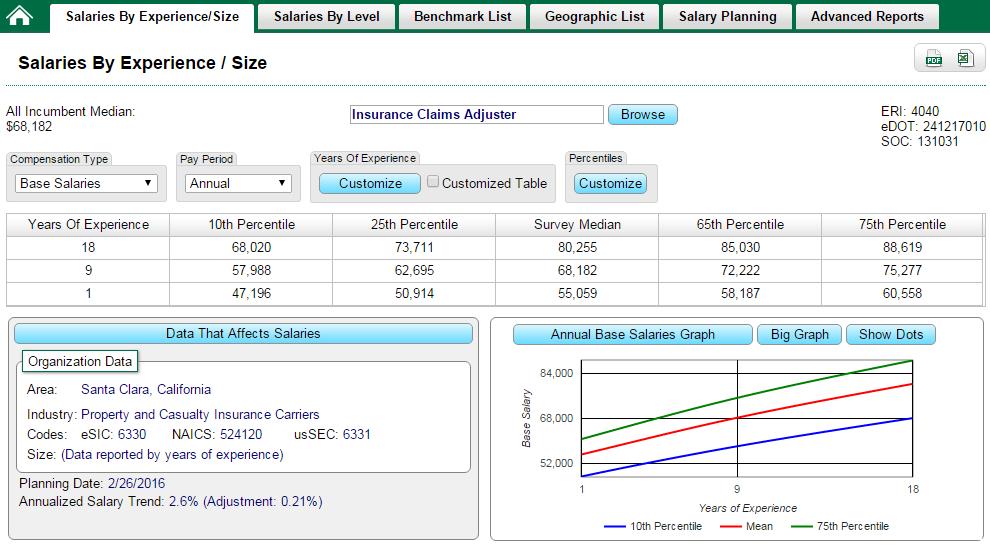
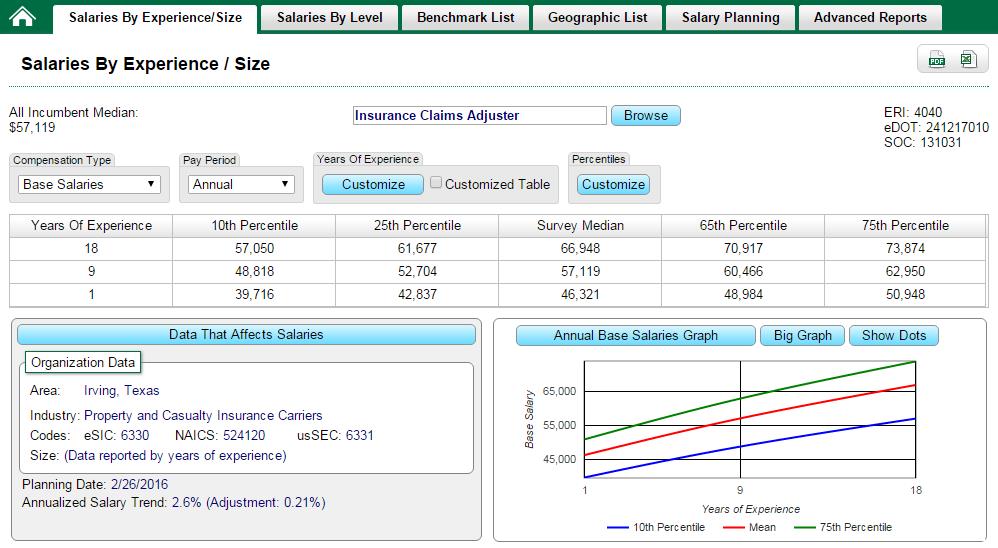
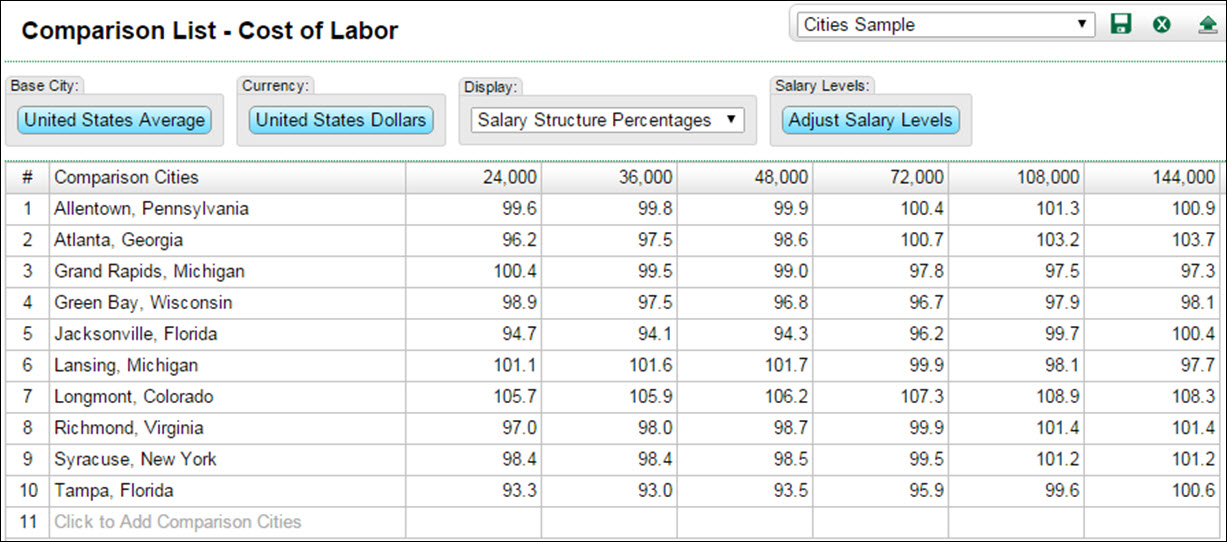
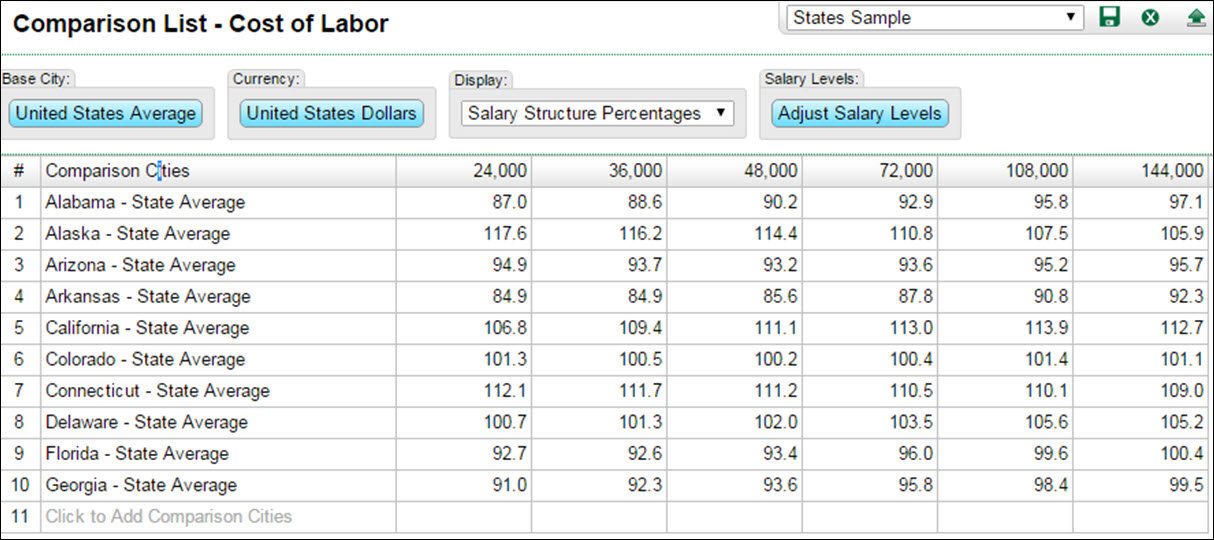
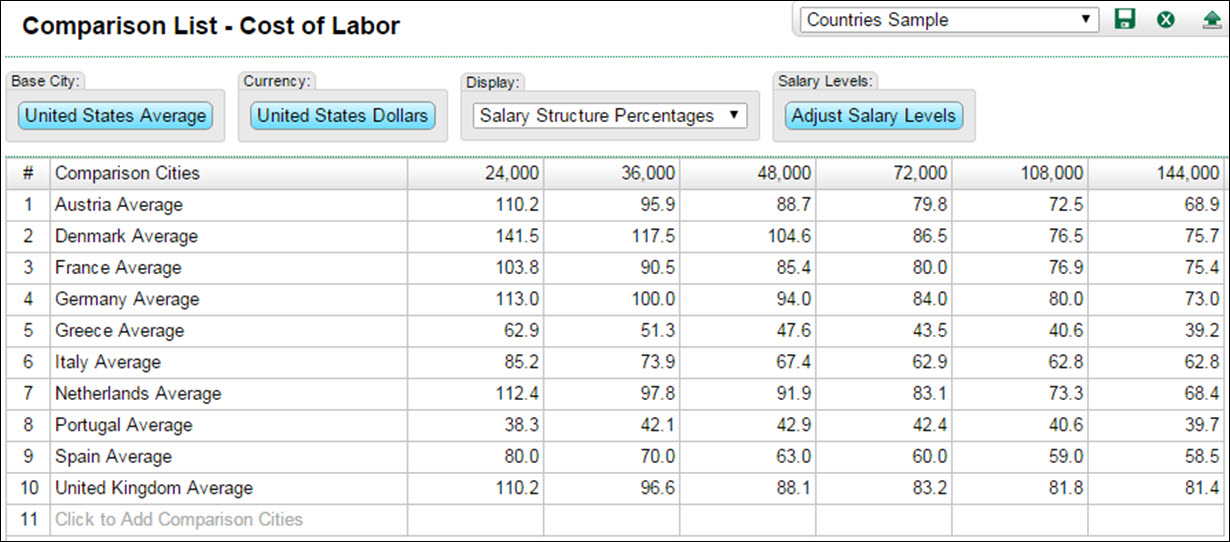
Image #2:  ERI’s Geographic Assessor (GA) – Comparison List

ERI's Geographic Assessor (GA) – Comparison List

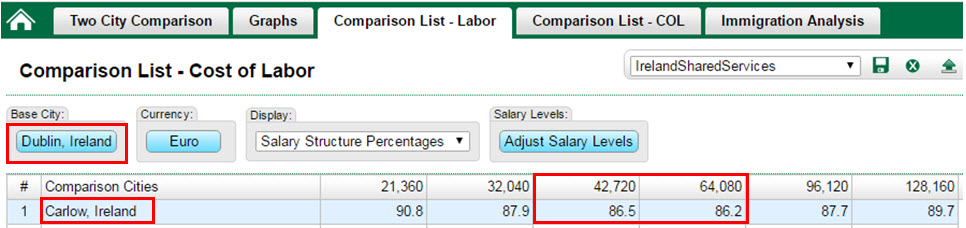
Based on this analysis, Carlow is attractive from a cost-of-labor perspective relative to Dublin.  The tables display a comparison of labor differentials for Carlow relative to Dublin at various salary levels.  Notice also for some of the higher paying positions at the $42,720 and $64,080 salary levels, the geographic labor market differentials are 14.5% and 14.8% lower than Dublin, respectively.

Labor costs continue to be one of the biggest line items on a company’s financial statement.  It can be invaluable for HR and total rewards leaders to have the tools to present business solutions that reliably estimate the financial implication.  ERI’s diligence in geographic labor market data collection and analysis results in robust and reliable compensation analytics not available elsewhere.  We continue to enhance our benchmarking solutions to meet the evolving demands of subscribers.  For more information about geographic labor market differentials and compensation analytics, give us a call today at 1-800-627-3697, and one of our Subscriber Services team members will be available to assist you.

What Are the New Benchmark Jobs Added in Compensation Surveys?

Reliable compensation benchmarks help to attract, hire, and engage top talent for critical jobs in your organization.  Throughout the year, ERI adds new jobs to the Salary Assessor by integrating standardized job descriptions into our compensation survey data collection process and analytics.  In addition to current subscribers submitting requests to include a new job, ERI conducts on-going comprehensive analysis of global job boards and labor statistics and monitors changes in occupational structures to expand the list of new jobs added to our compensation analytics.

These are the two most common approaches to benchmarking a new job:

  • Commission a consulting firm to do a custom survey, which can take 1 to 6 months to complete and have associated fees.
  • Reach out to your compensation analytics partner and request that your job be added. This generally requires 6 to 18 months and typically has no additional fee.

Reliable compensation benchmarks begin with standardized job descriptions.  All ERI descriptions are created in house by a team of analysts. The goal is to accurately describe occupations in a manner that is consistent.  These descriptions are standardized based on job content data collected from many sources.

ERI’s standard operating procedures (SOPs) for job descriptions outline the writing process.  All analysts are trained based on this procedure, which improves consistency. The language and terminology to describe occupations are standardized, facilitating the robust semantic search of ERI job description data when using the Salary Assessor.  Most organizations also have a structured process for their internal job descriptions.

Before ERI is able to write new job descriptions, it is necessary to collect data on the content of the jobs in question.  ERI uses two data sources to provide that information: job boards and job analyses.  The data from job boards provide meaningful insight into labor markets with over one million descriptions each year.  ERI’s job analysts study job content data for standard terminology.  By doing so, they identify information on the common language used in the description of various occupations.  During data scrubbing, the analysts also examine individual descriptions to identify common themes.  The analysis team makes sense of the data collected and compiles this information in a manner that is accurate and consistent.

As part of the on-going research, we reach out to networks of HR and total rewards professionals, academic colleagues, and professional associations, while also participating in panel discussions with domain experts in the field of compensation benchmarking.  These interactions help to validate compensation analytics, derive new hypotheses to test, and, most importantly, have a dialogue about the business realities impacting jobs and occupations.

As a result of collecting and analyzing job content for decades, we have determined there are approximately 1,200 verbs that are used in job descriptions, and these verbs have a tendency to cluster around specific types of jobs (e.g., Directors are more likely to “direct”).  These verb clusters are included in our job description writing procedures and standardize the language that is used in our descriptions.  Currently, the Salary Assessor has over 7,000 positions that can be benchmarked and over 1,500 new benchmark jobs under review for addition to our compensation analytics.

Recently, there were 48 benchmark jobs added to the Salary Assessor reflecting various industry sectors and occupations.  The occupation, Medical and Health Services Managers, had over ten jobs added.  For three critical job functions in most organizations, Customer Relationship Management, Data Integration, and Data Analytics, several jobs were added.

The combination of procedures, data, and skilled professionals creates a reliable job description library that is the basis for HR and total rewards practitioners to consistently interpret jobs across companies, geographic areas, and industries.  ERI’s diligence in data collection and analysis results in robust and reliable compensation analytics not available elsewhere.  ERI continues to enhance its benchmarking solutions to meet the evolving demands of subscribers.  For more information about benchmark jobs and compensation analytics, give us a call today at 800-627-3697, and one of our Subscriber Services team members will be available to assist you.

Is the IRS Still Looking at Forms 990?

The recently released Internal Revenue Service Data Book for Fiscal Year (FY) 2015 included a few points of interest for those in the nonprofit sector filing Forms 990.  This is the first year of the online format for the publication, which provided links to the underlying data, a great step forward in improving accessibility.

In general, FY 2015 was the fifth consecutive year of reductions to the overall IRS budget.  Full-time-equivalent staffing is more that 15% lower than 5 years ago.  The IRS processed 1.58 million returns filed by tax-exempt organizations in FY 2015, an increase of 7.7% over the 1.47 million in FY 2014.  Of the 1.58 million tax-exempt returns, 951,349 were filed electronically – over 60%.  The curious situation in the nonprofit sector is that the very smallest organizations filing the Form 990-N are required to e-file (well over 500,000 in FY 2015), and also the very largest nonprofits are required to e-file.  E-filing among the rest of the nonprofit world is growing, but Congressional action is needed to require all to e-file.  For more information on this strange situation, see this related blog post.

How Many Nonprofit Forms 990 Is the IRS Reviewing?

The table below shows highlights of the IRS Examinations of Tax Exempt Organization Returns in FY 2015.

So the number of examinations looks really low – out of all the returns processed, only about 2,700 were selected for examination.  Although this seems to indicate that the IRS is not doing much in the way of enforcement, it should be interpreted in the context of the IRS approach.  The IRS is focused on using Form 990 data, as well as data reported by charities or other parts of the IRS, to first identify which organizations are most likely to be out of compliance.  While the actual number of formal examinations reported above is small in proportion to the returns filed, a review of all returns is done to check for outliers.  The number of related returns examined that reflect “employment” above shows that IRS is also checking to see that the employment and wage reports are consistent with Form 990 reporting.

Use Data to Avoid Being an Outlier

So charities should be aware that the increased focus of the IRS on a “data-driven” approach requires care in reporting – whatever the number of actual examinations and the declining IRS budget.  While the number of examinations may not be great, those nonprofits actually examined are likely to be problem organizations.  To avoid standing out in that initial IRS data check, nonprofits should do what the IRS requires – use data to set policies and determine salaries that are comparable with their peers, and make sure that other filings to the IRS on wages and employment reflect accurately what is reported on the Form 990.

ERI’s Nonprofit Comparables Assessor (CA) provides detailed salary information for executives listed on the Form 990 and analysis of average salaries and ranges, so it is quickly evident if salaries are out of line.  CA also generates a list of organizations that meet the various criteria of organization type, size, and geographic location so that a set of comparables can be chosen for more nuanced analysis.

While the IRS examination numbers are not impressive, it is clear that the emphasis on data is making IRS enforcement dollars stretch further.  The IRS is watching – perhaps just more efficiently than in the past.

Charity Revenues on the Rise – Will Executive Compensation Also Increase?

A recently published Nonprofit Research Collaborative (NRC) survey of charities found 69% of respondents anticipated improved fundraising results in 2016, compared with 2015.  In addition, 50% saw fund-raising receipts increase during the first half of 2015, compared with the same six months in 2014. These findings indicate a relatively robust charitable sector with growing revenues.

But as usual, there are many differences among sizes and types of organizations within the nonprofit sector.  IRS statistics show nonprofit growth in recent years, but a research report by the Urban Institute’s National Center for Charitable Statistics found that some did far better than others.  Consider these examples:

  • 43% of environment and animal charities and 42% of international and foreign affairs organizations saw an increase greater than 10% in gross receipts during 2014.  They also showed the most volatility – 35% of international and foreign affairs and 32% of environment and animal organizations reported big losses in gross receipts.
  • Smaller charities tended to show larger fluctuations (growth and decline) when looking at year-to-year growth rates than larger organizations.
  • Public charity growth is strong, but is still not back up to pre-recession levels. The median growth rate in 2014 was 2.7%, more than in 2013 and 2012, but less than pre-recession rates of 4-5%

So will these increased revenues lead to higher charity executive salaries in 2016?  As usual, average increases for the sector and even within subsectors are not of much use for those who are tasked with determining compensation levels.  A much more detailed and nuanced analysis is needed.

ERI’s Nonprofit Comparables Assessor (CA) provides the data needed to select truly comparable organizations – required by IRS regulations.  The CA user can select criteria – size (based on annual revenues or assets), type of organization (a detailed National Taxonomy of Exempt Entities code), and geographic location – to calculate averages for direct compensation, based on the Forms 990 filed by all organizations that meet the criteria.  Next, a much smaller list of organizations that are closely comparable can be generated for further review and analysis.

In general, the most important determining factor for compensation tends to be size of organization, measured by annual revenues or assets in the CA.  (See this Frumkin-Keating paper.)  In some types of organizations, it may be necessary to use both measures to make sure the closest comparable organizations are considered.  Consider these examples:

  • Compensation for art and education CEOs also shows a significant association with the level of fixed assets, as well as size of revenues.
  • Health CEO compensation is not only related to organizational size but also influenced by size of the endowment.
  • Revenue size is not the most relevant measure of size for foundations – size of assets is more appropriate to use.

Results using a different measure for size could vary widely, as shown in the table below.  Say the search is for appropriate CEO compensation for leading a museum with $25 million in annual revenue and assets of $225 million.  Using the $25 million in revenues leads to an estimate of a CEO salary of about $295,000, while considering the assets of $225 million gives a much higher estimate of nearly $400,000.

CEO Compensation for Museums, US Averages

So which estimate is most relevant?  CA users can create a list of the museums closest in revenue size and then a second list using asset size, perhaps a total of 20 organizations, to help in that decision.  Combining the lists will reveal which museums appear on both lists and which have similar relationships between revenue and asset levels.  The user should be able to judge which ones are most relevant to the comparison and determine a rationale for choosing a compensation level for the CEO based on comparable data.  CA provides a way to easily collect all the relevant data on which to base compensation decisions.

talent management

Talent Management and Employee Relocation

Organizations are offering more innovative, flexible relocation programs as a way to align talent management strategies to business operation demands and to better compete in the war for talent.  The employee (and family members), performance managers, and human resources are critical stakeholders in the process.  Whether the company initiates a relocation for business and professional development purposes or the employee initiates it for personal family or career interests, the stakeholders collaborate to make an informed decision about the move.  Cost of living, compensation, and career management are three factors that need to be evaluated to ensure a relocation is successful (see ERI Distance Learning Center course #57, Relocate an Employee Within the United States, for more information on this topic).

Insight from HR leaders might include the following:

Aligning total rewards with talent management programs helps to drive positive business outcomes.  The graphics below offer a framework to evaluate relocation programs by the type of talent relative to the business impact and employee development.

Another layer of analysis involves segmenting the employee profiles by their demographics.  When employee demographics are combined with the type of talent, you can gain insight to design the most cost-effective relocation programs.  The graphic below shows one way to segment employee demographics (although the age categories may not always correspond to the attributes).

For example, best practices organizations are pairing less experienced employees with empty nesters who have depth and breadth of experience than can be shared with or transferred to other staff as part of career development through training, mentorship, or coaching programs.  Also, for these empty nesters, relocations to lower cost-of-living operations may support their financial goals.

Relocating an employee requires a significant amount of financial investment and employee commitment to be successful.  A move can typically cost anywhere from $25K up to $3M for an executive relocation.  Making a well informed decision related to cost-of-living differences and how the household’s standard of living will be affected will contribute to the success of a relocation.   Key inputs to understanding cost-of-living differentials include evaluating six categories of expenditures:

ERI’s Relocation Assessor is a trusted source for cost-of-living analytics that help companies support talent management objectives and related relocation processes.  The analysis is customized to the employee scenario with several inputs that are user-defined.  Let’s take a look at the cost-of-living analytics table of an employee relocation for an early career professional, John Smith, with the following inputs:

  • Employee Earnings =  $58,000 (e.g., $55,000 base salary plus $3,000 annual incentive)
  • Tax Residence = U.S.
  • Family Size = 1
  • Base City = Santa Clara, CA
  • Destination City = Irving , TX
  • Housing:
    • Square Footage = 700
    • Rent or Own? = Rent
  • House Payment Assumptions for Homeowners = Not Applicable
  • Automobile:
    • Number Owned = 1
    • Total Value = $10,000
    • Mileage = 20,000

Relocation Assessor – Two City Cost Comparison:

Based on John Smith’s scenario, the cost of living in Irving, Texas, is 30.9% lower than in Santa Clara, CA.  Housing is the largest expenditure and represents most of the savings in this move ($13,022), then taxes ($2,458), consumables ($1,457), transportation ($861), and health services ($121).  There are financial advantages from a cost-of-living perspective.

Next, assess the compensation implications associated with a relocation.  The base salary compensation programs for early career professionals are generally based on local labor markets.  Further analysis of John Smith’s move to Irving, Texas, will require aligning to geographic salary levels for internal equity, broader engagement, and talent retention objectives.   Continuing with this example, we start by comparing the base salary benchmarks for John Smith’s job, Insurance Claims Adjuster, in Santa Clara versus Irving, while also adjusting for the Property and Casualty Insurance Carriers industry differential.

Salary Assessor – Base Salary Benchmark for Santa Clara:

Based on the two Insurance Claims Adjuster salary benchmarks, the Irving labor markets differential is $8,738, which is 15.9% lower than Santa Clara, with the median salaries of $46,321 and $55,059, respectively, for an incumbent with one year of experience.  John’s employer has regional geographic structures that assign a work location to a different region when there is at least a 10% differential, which is evaluated on yearly basis.  Santa Clara is in a Tier 2 region and Irving is in a Tier 3 region (Tier 1 has NYC, Greenwich, CT, and Palo Alto, CA).  See ERI Distance Learning Center course #83, Designing a Branch Office Salary Structure, for more information on geographic structures.

Next, career management is the more complex topic which evaluates employee’s career goals and development plans relative to the relocation and broader organization business objectives.  Best practices in career management can include aligning career goals with business objectives, continuous learning culture, business leadership sponsorship, cross-functional support, and employee ownership and self-assessment.  The glue in effective best practices includes communication and transparency.

Now the stakeholders have a complete picture of the financial and non-financial implications of John Smith’s relocation to Irving from Santa Clara as follows:

"

Summary

Competing and winning in the war for talent requires flexible, proactive relocation programs to be responsive to changing business needs from operations and workforce perspectives.  High performance organizations support relocation programs with financial and non-financial total rewards policies that are fair, competitive, and foster employee career growth and retention.  By doing so, they are expanding their internal labor market capability and their employer brand equity, which are differentiating competitive advantages for the organization.  If you have any questions or want to discuss salary and relocation analytics further, call our “best in class” service team at 1-800-627-3697 or visit www.erieri.com.


Compensation Benchmarks for Winning Bids

Privately-owned and publicly-traded companies have lines of business dedicated to successfully participating in the bidding process initiated with a Request for Proposal (RFP) by a government entity. There are many criteria that companies need to satisfy in order to be awarded a government contract.  One is providing pricing that includes reasonable labor cost estimates that reflect the prevailing wage.  Companies deriving labor costs from current internal pay levels will generally have a practice of externally benchmarking the prevailing wage.  External compensation benchmarks will be specific to geography and industry, have a large sample size, report both the mean and median, and be matched to the job requirements.

The labor cost estimates for government contracts have been regulated through prevailing wage legislation beginning as early at 1931 with the Davis-Bacon Act of 1931, followed by the Walsh-Healy Public Contracts Act of 1936 and then the McNamara-O’Hara Service Contract Act of 1965 (for more information, see ERI Distance Learning Center course 15, Federal Employment Laws That Impact Compensation and Benefits).  ERI’s Salary Assessor (SA) and Executive Compensation Assessor (XA) provide non-executive and executive compensation analytics benchmarks for prevailing wage estimates.

Let’s look at an example from the Salary Assessor, customizing the criteria by geography, industry, and job level, which then generates a report that includes sample size with accompanying standard errors.  The criteria selected are Project Coordinator in the Aerospace Manufacturing industry in the Birmingham Alabama labor market.  The prevailing wage benchmark is displayed below.

Salary Assessor:  Median Prevailing Wage Benchmark

The job requirements for a project may vary, so it is essential to have a benchmarking tool that has the flexibility to submit labor costs that are aligned to the business opportunity.  Using the above table, you can pull many different compensation benchmarks:

  • Job requirement is entry level with 1 year of experience:  Estimate = $37,366
  • Job requirement is mastery skills level with 10 years of experience:  Estimate = $51,136
  • Job requirement does not specify years of experience:  Estimate = $47,035

Next let’s look at the associated reliability statistics for this benchmark.

Salary Assessor: Reliability Statistics

The associated reliability statistics for the Project Coordinator prevailing wage benchmark has 660 observations, with a standard error of 3.1% and a corresponding population error of 6.6%.  Although the geographic criteria selected used the city of Birmingham, the Area is defined as Birmingham-Hoover since ERI analyses have identified these adjacent cities as effectively part of the same labor market. That is, the demand and supply for labor in these cities is similar.

Similar analysis for executive jobs can be determined by the revenue scope of the executive’s role versus years of experience for the Project Coordinator example, a non-executive role.

Executive Compensation Assessor: Chief Executive Officer (CEO)

The median base salary benchmark for CEO is $748,806 with a corresponding $1.3 billion revenue scope.  When the revenue scope is increased to $13 billion, the median base salary benchmark changes to $1,220,455; when decreased to $130 million, the median value is $456,663.

Next let’s look at the associated reliability statistics for this benchmark.

Executive Compensation Assessor: Reliability Statistics

The associated reliability statistics for the CEO prevailing wage benchmark has 340 observations, with a standard error of 4.5% and a corresponding population error of 9.6%.  The Area is also defined as Birmingham-Hoover, as noted earlier.

With executive compensation, in addition to the prevailing wage, the concept of maximum reasonable compensation may also factor into the labor cost estimates for executive employees included in a government contract bid.  In the IRS determination of reasonable compensation, one of the main considerations is that of comparable wages.  Maximum reasonable compensation is the highest amount of compensation (both wages and bonus) allowed to be used as a business expense for services rendered in comparable circumstances.  Depending on the final executive cost of labor estimate submitted, it may be good practice to evaluate the maximum reasonable benchmark.  This benchmark is also available in ERI’s Executive Compensation Assessor.

Let’s review a maximum reasonable compensation benchmark building on the current CEO example.

Executive Compensation Assessor: Maximum Reasonable Estimate

Based on this maximum reasonable compensation benchmark, you want to bid the CEO labor cost associated with the $748,000 to $3.36 million range.  Since it is likely that the CEO will not dedicate 100% time to a single contract, the labor estimates would be based on the amount of time spent derived by hourly rates (the annual rate divided by 2080 annual hours).  The annual compensation range above is equivalent to $360/hour to $1,615/hour.  (For more information see ERI Distance Learning Center course 12, IRS Reasonable Executive Compensation.)

Summary 

Partnering with an established data partner that provides a reliable source of external compensation benchmarks for prevailing wage can be invaluable.  Private sector organizations that have business units dedicated to government sectors clients have to submit winning bids to compete with top tier firms.  Having the most robust data source for including reasonable labor cost estimates validated with external compensation benchmarks can give you a competitive advantage.  For more information about compensation benchmarking, call our “best in class” service team at or visit www.erieri.com.

The Wounded Warrior Project – Spending Too Much on CEO Compensation?

The Wounded Warrior Project (WWP), a fast growing and media-savvy charity serving veterans, has recently been in the news and not in a good way.  See a recent article in the New York Times and a blog post from GuideStar CEO Jacob Herald.  There were charges of spending too much on expenses (e.g., fund-raising, travel, and executive compensation) that were not directly related to its mission of direct services to veterans.

While there appears to be justification for some of the criticism (perhaps the extravagant staff retreat), there is also the usual failure to acknowledge that spending on overhead and management is necessary in a complex organization – WWP collected over $340,000,000 in annual revenues and is growing rapidly, provides multiple services and programs across the US, and has 500 employees. All organizations, both for-profit and nonprofit, have to invest in themselves to be successful, whether that success is defined as making profits or achieving their charitable missions.

The salaries paid to WWP’s executives have also come under scrutiny.  Nonprofit executive pay always seems to bring out strong opinions – although it may be considered a privilege by some to work at a nonprofit organization, nonprofit executives typically also have complicated and difficult jobs. There should be justification and accountability for determining what executive compensation should be paid, but organizations also need to attract and retain the talented, capable people required to do these jobs.

So how does compensation stack up at WWP?  ERI’s Nonprofit Comparables Assessor (CA) can give us some indication of whether the CEO is making a similar amount to CEOs in similar organizations – the criteria that the IRS uses to assess whether or not compensation is reasonable.  WWP reported that the CEO was paid about $473,000 in taxable compensation in 2013 on a Form 990 filed on time in May 2015, the most recent form available for analysis. Revenues were listed as $342 million annually.

Using the Nonprofit Comparables Assessor and selecting all human services organizations with annual revenues of $350 million, the average CEO compensation is shown on the first line of the table below.  The next line shows the averages for CEOs of all types of nonprofits, not just those providing human services with the same revenue size of $350 million.  Finally, to add perspective, ERI’s Salary Assessor was used to estimate what the CEO of a similar-sized for-profit company would make.  While WWP is based in Florida, the US average was used, because the search for a new executive for this size organization would be nationwide.

Compensation for CEO of Organization with $350 Million in Revenues

So, while perhaps there may be criticism for some WWP expenses and fund-raising practices, its level of CEO compensation appears to be in line with other similar organizations in the nonprofit sector.  What’s more, it is clearly less than the CEO salaries in the for-profit world.

Labor Markets and Geographic Differentials

Labor Markets and Geographic Differentials

Depending on whether the economy is experiencing growth or a recession, the private and government sectors have different strategies to manage them.  Recent macro-level topics focus on the need to create better quality jobs that grow the middle-income household segment while facing skills shortages, as in Science, Technology, Engineering, and Math (STEM) jobs, for example.  At ERI, we help subscribers determine the cost impact of their strategies through the application of compensation analytics.  As stakeholders, HR leaders want a trusted partner to keep a pulse on the competitive advantages of geographic labor cost differentials in light of external market conditions.

Consider these questions presented by HR leaders:

Labor markets and the associated geographic differentials are a significant driver of business operations.  A labor market is defined as follows:

  • An area in which buyers and sellers are in close enough communication that price tends to be the same throughout the area
  • Labor costs are determined by the supply and demand of a specific skill type and skill level

Labor Market Supply and Demand

From a financial perspective, depending on the business decision you are addressing, you may want to understand the geographic labor cost advantages from different segmentation analyses.  ERI’s Geographic Assessor (GA) provides geographic labor cost differentials for base salary level changes (not fully loaded costs with taxes and benefits) represented by eight regression lines, limiting the lowest possible user-selected base city level to the minimum wage.  The eight “best fit” regression lines are assigned a salary range and a structure name.  (See ERI’s Distance Learning Center course #49, Regression Analysis Used in Compensation Administration.)  The eight structures follow:

Depending on the business decision you are making, you may want to analyze geographic labor cost differentials on a citywide, statewide, or countrywide basis. Below are compensation analytics that provide cost of labor geographic differentials for each type of analysis.

ERI’s Geographic Assessor:  Citywide Sample Comparison List

Consider the insight that HR leaders gain from GA’s Comparison List samples above:

  • Citywide Sample Comparison List — Longmont, Colorado has the highest cost of labor for lesser skilled jobs (5.7% higher than the US Average cost of labor);
  • Statewide Sample Comparison List — The state of Arkansas has the lowest cost of labor across all job levels.  Arizona differentials compared to the US Average across all job levels range from 93.2% to 95.7%, which is very tight.  Hiring a Receptionist or a CEO in Arizona will result in 4.3% to 6.8% lower labor costs.
  • Countrywide Sample Comparison List — Portugal’s cost of labor is the lowest.  The geographic differentials for higher skilled jobs progressively decrease in Europe (except for Portugal).  Spain, for example, at the lowest structure of $24,000 is 80% of the US Average, then 70% at the $36,000 level, and continues to decrease to 58.5% for the highest structure.

Summary

High performance organizations understand the financial and operational implications of changes in external markets by having rigorous processes to keep track of these factors.  Partnerships with data analytics companies, like ERI Economic Research Institute, that provide trusted, real-time analytics serve as an essential part of the overall HR infrastructure.   For more information, call our “best in class” service team at 800-627-3697 or visit www.erieri.com.

U.S. Labor Market Tightens

Two recent government data releases have suggested tightening labor market conditions.  On February 5th, the government released its Current Employment Statistics monthly employment report for January.  Average Hourly Earnings for all private employees was up 2.5% on a year-over-year basis.  As the graph below shows, there is a clear upward trend in the last year that is in marked contrast to the preceding five years.

Read more about the January employment report at www.calculatedriskblog.com/2016/02/comments-solid-employment-report.html.

On February 9th, the Bureau of Labor Statistics released its Job Openings and Labor Turnover Summary for December.   This report includes a measure that is correlated with future wage growth: voluntary separations initiated by the employee or quits.  There were 3.1 million quits in December, which is the highest number since before the recession.  Quits were up 13% year over year.

Recent data suggests that compensation professionals should be increasing their benchmarking efforts given the tightening labor market and the increased confidence of employees who are more likely to be exploring the market.  Try a demo of ERI’s Assessor Series to see why thousands of companies including the majority of the Fortune 500 use ERI to plan compensation.


When Not to Be an Outlier

While there are some situations that call for standing out from the crowd, setting nonprofit executive compensation is not one of them – that is, unless there is a thoughtful process that is not only supported by data, but also well-documented, and justifies a higher-than-expected salary.

The IRS is looking for outliers when it investigates compensation for nonprofit executives. When nonprofit executive salaries are at the higher end of the range for similar nonprofits, it becomes very important to take all the necessary steps to document that compensation is reasonable.  The IRS looks at compensation data reported on Forms 990 and so should those who are responsible for determining what compensation should be in their organization.

An easy first step to see if a particular executive salary is an outlier is to use ERI’s Nonprofit Comparables Assessor (CA).  The IRS wants data for “similar organizations” to be used in the comparison, so the CA software uses the Form 990 data from organizations with similar characteristics to calculate an average salary.  “Similar” organizations are defined based on criteria chosen by the user – for example, similar in type and services provided (the National Taxonomy of Exempt Entities code); similar in size (annual revenues reported on Form 990); and similar in geographic location (all US, one state, or selected states).  The table below, generated by ERI’s Nonprofit Comparables Assessor, shows the expected direct compensation for the CEO of a mid-sized Human Services organization in California, based on data reported in the Forms 990 of organizations meeting the selection criteria.

So if the CEO in question is paid less than or around $155,000, then the organization can feel pretty comfortable that there will be few questions about reasonable compensation from regulators, charity watch groups, clients, funders, etc.   However, if the pay is much higher, say more than $195,000, additional data are needed for documentation that will be available to respond to possible questions about salary levels.

The next step is collecting more detailed data on perhaps 10 to 15 organizations that are most similar – the organizations that may be those providing similar services that have CEOs with similar backgrounds and experience.  Again ERI’s CA can easily provide a list of all organizations that meet the selected criteria, and then the user can select the closest in size, geography, and mission name.  The list also includes a link to the Form 990 of each organization so that the most recent form can be accessed and a detailed review of the purpose and compensation can be completed. The table below from ERI’s Nonprofit Comparables Assessor shows four of a larger list of similar-sized Human Services organizations with revenues of $10-11 million in California, reflecting a range of salaries.

From a list of all organizations that meet the criteria selected, more directly comparable organizations can be chosen for a closer look.  This could include a more precise type of Human Services organization, such as those providing after-school care versus literacy programs, or a more narrow range of revenue size, such as $9-12 million, or a smaller geographic area, such as the San Francisco Bay area versus the state of California.  The four organizations above pay their CEOs very different amounts, so it is crucial to be able to show which ones are most similar to determine what is reasonable for compensation.

Current regulations – federal and state – do not prevent an organization from paying on the higher end of the salary range for similar positions in similar organizations.  In fact, higher total compensation can be reasonable given an employee’s experience and expertise, plus any special circumstances.  What paying at a higher level does require is data that support such compensation as fair and reasonable.

Compensation decisions must be thoughtful and backed up with data.  ERI’s Nonprofit Comparables Assessor provides easy access to the same Form 990 compensation data that regulators are using to locate outliers.  If nonprofit executive pay is above what might be expected, then it is important to collect, analyze, and make decisions based on the data.