nonprofit executive compensation

Nonprofit Executive Compensation: How Much Is Too Much?

An investigative report about the Goodwill Industries affiliate in Omaha in a local paper started by looking at high compensation levels for the Omaha executives, but then continued to look at the payment of hourly rates for disabled workers less than the minimum wage.  Then the issues of conflict of interest between board and staff, nepotism, and even the repackaging of foreign-made goods sold under “Made in America” labels were revealed.  As community support waned, there was serious discussion of withdrawing the county-granted organizational exemption from property tax. 

These revelations have dramatically changed the way Goodwill Omaha functions, and the charity will be heavily scrutinized for years to come.  The property tax exemption was just extended, but time will be needed to rebuild community trust.

Now the search is on for a new executive, and the charity should be carefully following the IRS prescribed procedures. These are detailed in ERI’s recent Guide to Setting Nonprofit Executive Compensation.

To summarize here, the IRS wants a charity to pay “reasonable compensation” – that is, “an amount as would ordinarily be paid for like services by like enterprises under like circumstances.”   So what does that really mean?  The IRS definitions follow:

  • Like services:  Jobs with substantially similar duties and responsibilities (e.g., the number of employees managed, the size of the budget or assets managed, hours worked, and geographic scope).
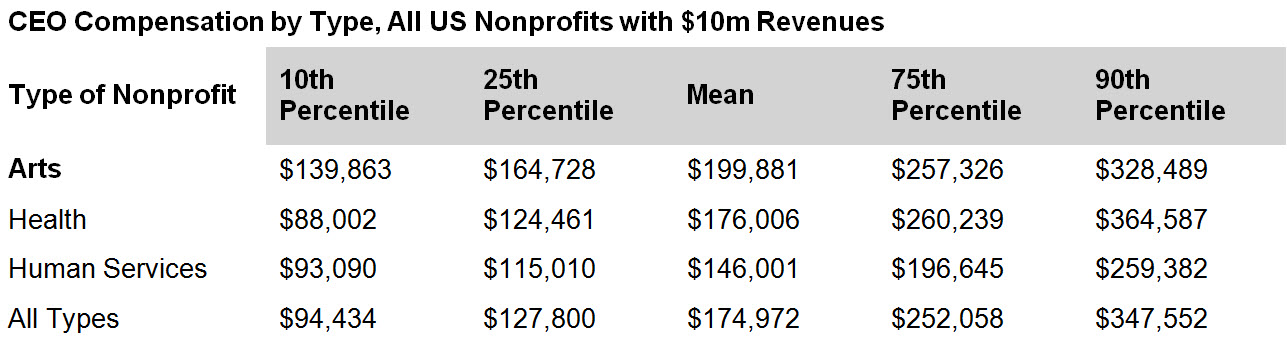
  • Like enterprises:  Organizations similar in size (based on such factors as annual budget, assets, number of employees, or number of persons served).  Equally important, organizations similar in services provided or purpose (e.g., universities compared with universities, day care centers with day care centers, etc.)   If the charity can show that tax-exempt and for-profit entities compete for the same pool of specialized talent, then the for-profit data can be used for some, but not all, of the comparative data.
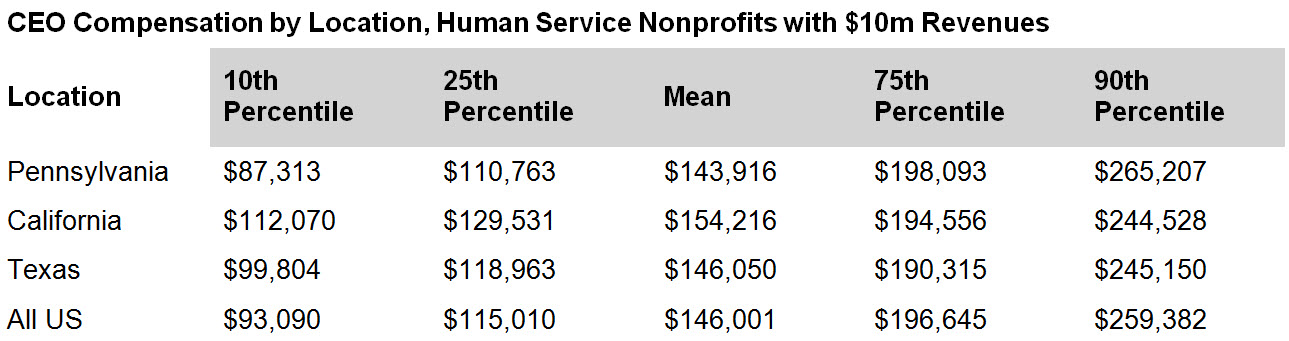
  • Like circumstances:  All forms of compensation included in the comparison (consider expense or housing allowances, plus other financial benefits). A review of geographic differences might call for adjustments.  Also if sufficient comparable data are not available for the geographic area, then comparables from a larger geographic region might be necessary, in addition to potential cost-of-living adjustments.

The IRS has decided that compensation will be presumed reasonable, unless proven otherwise, if the organization follows a set of standard procedures, creating what is termed a “rebuttable presumption of reasonableness.” This presumption puts the burden of proving that compensation is not reasonable on the IRS, not the organization.  The IRS requires these criteria for establishing the rebuttable presumption:

  • Approval by the authorized body of the organization (usually the full Board of Directors), but with no participation by anyone who might be affected by the decision on compensation.
  • Use of “appropriate data” to determine comparability prior to making a decision.  That means looking at what nonprofit employers with similar missions, and similar budget sizes, located in the same area, or a similar geographic region, pay their executives.
  • Documentation of the basis for the salary decision (who was involved with reviewing comparable data and his/her “independence,” the process used, etc.), all to demonstrate that comparable data were actually used when approving the compensation. 

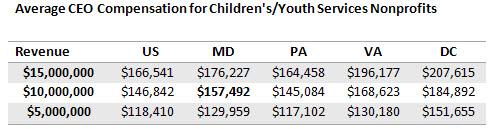
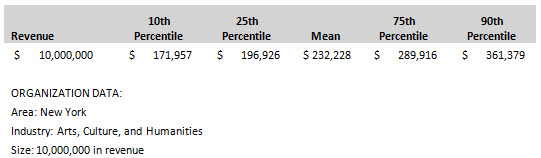
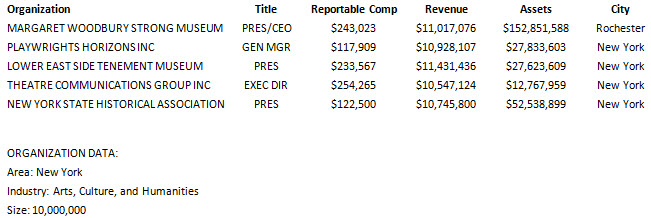
A first look at comparable data is easily obtained using ERI’s Nonprofit Comparables Assessor.  With criteria that fit the search for a new CEO at Goodwill Industries Omaha (job title CEO, annual revenue size of $25 million, and nonprofit organization type of “Employment, Job Related”), the table below generated by the Nonprofit Comparables Assessor shows that the average annual compensation for this job in comparable organizations is expected to be around $206,000 per year.  This is considerably less than the compensation paid to the CEO that just left the position.

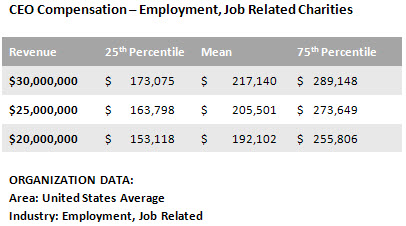
When the geographic criteria in the Nonprofit Comparables Assessor was changed to Nebraska, there were too few observations to create a table, since there are not that many large (for Nebraska) employment organizations in the state.  Recruitment for this position is likely to be national in scope, so the US average seems to be the most relevant for analyzing the market rate for this position. 

The Omaha charity knows that regaining the trust and support of the public is an issue now and that many eyes will be focused on the compensation of the new CEO.  Using comparable data to justify reasonable compensation levels as required by IRS rules and regulations is a significant first step in that process.

executive compensation

How to Determine the Salary for a Nonprofit Executive

All salary negotiations need to begin with research—both employer and employee need to collect meaningful data, not just anecdotes, about typical pay for genuinely comparable positions before beginning compensation discussions.  This approach not only makes sense for employers and the executives—it is what the IRS and charity regulators require.  See ERI’s Guide to Setting Nonprofit Executive Compensation for a detailed discussion.

For any given job, the level of pay is influenced most by where the job is donethat means (1) the size of the organization; (2) the type of organization; and (3) the geographic location.  In the nonprofit sector, the IRS focuses on preventing “excess compensation” and defines “reasonable compensation” as “an amount as would ordinarily be paid for like services by like enterprises under like circumstances.”

Using ERI’s Nonprofit Comparables Assessor, let’s research what is reasonable compensation for the CEO of a foster care agency in Baltimore, MD, with annual revenues of $10 million.  The goal is to find salaries for people who are working in similar organizations with similar responsibilities in order to determine the market rate for the position.  The Nonprofit Comparables Assessor database of IRS Form 990 compensation information filed by almost all US nonprofits can be searched selecting the following criteria:

  • Job Title:  CEO
  • Type of Nonprofit Organization:  Children’s/Youth Services (where a person with the requisite skills and background and similar responsibilities might be working)
  • Location:  All US and then a selection of the states of MD, PA, VA, plus the District of Columbia (all places where potential candidates might be working and also places where potential candidates for CEO of a Baltimore-based foster care organization might be employed)
  • Size:  Annual revenues of between $5 million and $15 million (creating a range around the actual revenues of the organization seeking the market rate for its CEO)

Those criteria are chosen with an eye to the labor market for that CEO positionwhere would such a person be working with responsibilities for procuring and administering state contracts, recruiting and training foster care parents, dealing with a similar number of staff people, etc.?   The idea is to collect compensation for those with similar titles (CEO) in organizations providing similar services (children’s/youth services), and in a similar geographic location (MD and surrounding areas, where the organizations might compete for talent).  The search only takes a minute with ERI’s Nonprofit Comparables Assessor and yields the following table.

The table reveals that a reasonable salary for the CEO of this $10 million nonprofit might range from $150,000 to $160,000, but there are many other factors that may enter into determining a final compensation number. Although the national average for the job is lower (around $147,000), the Mid- Atlantic geographic area where potential candidates might come from has a higher average, with the exception of Pennsylvania.  To attract someone from DC or VA, the organization might have to pay more, while perhaps someone in PA would be attracted to the job, as average CEO pay in similar organizations is lower there.  Other factors that should be considered include the experience level of the candidate or current CEO, the stability and/or growth outlook for the organization (their ability to pay), the compensation philosophy of the organization (some pay top dollar to get the best and the brightest, while others try to find less-experienced or less-qualified people and pay them less).  Underpaying people tends to lead to turnover, as the CEO leaves to get the market rate.

Having information on CEO compensation levels in comparable organizations can prepare both the potential employer and the potential CEO for meaningful salary negotiations, in line with the IRS and state charity regulators’ rules and regulations. Using ERI’s Nonprofit Comparables Assessor easily provides that valuable market data.

ERI Economic Research Institute compiles the most robust salary, cost-of-living, and executive compensation survey data available, with current market data for more than 1,000 industry sectors.

ERI’s Assessor Series® – Solutions for every compensation decision

Try a FREE DemoRequest a Guided Tour

Nonprofit Executive Compensation

Tips on Setting Nonprofit Executive Compensation in 2017

There always seems to be plenty of interest in levels of nonprofit executive compensation – not only from federal and state government regulators, and even Congress on occasion, but also the media. The threat of financial penalties has heightened, but the loss of public support and credibility for charities is also a major factor.  This is the time for tax-exempt organizations to increase the time and attention devoted to investigating, deliberating, documenting, and reporting executive compensation.

While nonprofit executives may be very focused on the mission of their organizations, they still have themselves and their families to support.  Regardless of size or tax status, all organizations need to attract, motivate, and retain the right employees to ensure their continued success.  That means setting compensation at market rates that are also in accordance with IRS rules and regulations for those with tax-exempt status. Every nonprofit with employees should take a number of organizational steps to make sure that there are policies and procedures in place to ensure compensation decisions are in line with its goals and compliant with laws and regulations.  These are outlined in ERI’s new white paper entitled, “Guide to Setting Nonprofit Executive Compensation.”

Requirements for Setting Nonprofit Executive Pay

The IRS says that reasonable compensation is the amount that would ordinarily be paid for like services by like enterprises, whether taxable or tax-exempt, as defined below:

  • Like services.  This entails jobs with substantially similar duties and responsibilities, including such factors as the number of employees managed, the size of the budget or assets managed, hours worked, and scope (national or local).
  • Like enterprises.  This is defined as enterprises that are similar in size, usually measured by budget, assets, number of employees, or number of persons served, and also enterprises providing similar services.
  • Like circumstances.  This includes all forms of compensation in the comparison, as well as geographic area (perhaps a cost-of-living adjustment).

The Rebuttable Presumption

The IRS has decided that compensation will be presumed reasonable, unless proven otherwise, if the organization follows a set of standard procedures, creating what is termed a “rebuttable presumption of reasonableness.” This presumption means that it is the responsibility of IRS to prove that a transaction involved excess benefit, not the Form 990 filer to prove reasonable benefit. The organization must follow these steps:

  • Approve the compensation decision – that typically means the full Board of Directors, but with no participation by anyone who might be affected by the decision on compensation.
  • Use “appropriate data” to determine comparability (similar nonprofit employers with similar missions, and similar budget sizes, that are located in the same, or a similar geographic region).
  • Document the basis for its compensation determination while making its decision.

ERI’s Nonprofit Comparables Assessor

This software can easily collect the needed comparable data.  It calculates average salaries for specific nonprofit executive jobs based on the criteria used by the IRS to assess comparability – type of nonprofit, size, and geographic location. The data used in the software include salaries from all Forms 990, updated every time a new form is filed.  This is the most comprehensive data source available, as data from all Form 990 filers are included.  The software also provides a list of comparable organizations that can be refined to a smaller number targeted for further in-depth research.   More guidance on collecting and using these comparable data are included in the Guide to Setting Nonprofit Executive Compensation white paper.

Following the steps outlined above results in compensation decisions that will pass review by the IRS and other stakeholders and meet the goal of attracting and retaining the executives needed to sustain the organization.  ERI’s Nonprofit Comparables Assessor provides a simple and cost-effective way to collect and analyze the comparable data needed in that process.

Boards Need to Get Nonprofit Executive Compensation Right

Boards of nonprofits are tasked with setting compensation for their executives, and there are some compelling reasons to do it right.

#1 – IRS Review

Federal tax law prohibits individuals who control or have a close relationship with nonprofit organizations from benefiting unfairly from the entity’s assets.  The IRS will be reviewing the compensation for executives, as the organizations must file a Form 990 each year that includes that data.  (Note that, in some states, there will also be a review by state charity regulators.)

#2 – Public Scrutiny

Forms 990 are public information, available by law from the organization and posted on several web sites.  This means that potential funders (e.g., governments and private foundations) and individual donors can easily review salary levels, as well as the media, and even users of the services nonprofits are providing.  Salaries that look excessive may be a problem for those looking to support a charity or use its services.

#3 – Proper Use of Charitable Funds     

Board members have a fiduciary responsibility to use charitable funds properly – paying salaries that are not supported with comparable data, as required by IRS regulations, does not meet that test.  If the Board has based pay decisions on compensation paid to executives providing “like services by like enterprises under like circumstances” according to Form 990 instructions, then the Board has exercised appropriate care in allocating charitable resources.

Making the “Right” Decision on Pay

Nonprofit executives (and key employees) should receive “reasonable compensation,” which the IRS does not define precisely, leaving the term open to a wide variety of interpretations. As a result, the IRS reviews executive compensation – and penalizes – tax-exempt organizations that excessively reward their leaders.

Some organizations, like the National Football League, have actually relinquished tax-exempt status, at least partially because of negative attention to top executive pay in a “nonprofit.”  Learn more about that change to for-profit status in my 2015 blog post.

While the IRS does not define “excessive compensation,” there are guidelines for determining executive compensation, and the IRS actually seems more interested in knowing the process used, as it views increased transparency as a way to limit excess compensation.  The IRS wants boards to collect and use data from comparable organizations to set salaries, so the crucial step is to determine which organizations are comparable.  According to the IRS, this data are most likely relevant if from organizations that fulfill these criteria:

  • Similar in purpose, service provided, or activity.  For example, day care providers should be compared with other day care providers and hospitals with other hospitals.  The IRS uses the National Taxonomy of Exempt Entities (NTEE) code to categorize all types of nonprofits, so using these codes helps identify similar entities.  Find more information at http://nccs.urban.org/classification/national-taxonomy-exempt-entities.
  • Similar in size.   This is typically measured using annual revenues listed on the Form 990.  For some types of nonprofits, such as credit unions or foundations, the most appropriate measure of size might be assets, rather than revenues.
  • Similar in geographic location.  This may or may not be used depending on the labor market for the position of interest.  If executives qualify and compete for this job in the local area (e.g., the executive director of a day care provider), then the local region should be searched for comparable organizations.  However, if this is a large national organization (e.g., a large hospital), then the search for a successor would include major cities or all 50 US states; in this case, the search for comparable entities should be expanded to a larger area.

Once comparable organizations are found, the next research step is the job match – for example, do the Chief Operating Officers in the comparable organizations actually have similar job duties and responsibilities to the COO in the organization of interest? Are similar education levels and similar credentials/licenses, if any, required?

If these criteria are met, then data on compensation will probably be deemed relevant by IRS.  However, the board is permitted to take other factors into account when the final compensation is set.  The IRS is most interested in making sure that the process of collecting comparable data was completed and that the data were used in the discussion of compensation levels.   Of course, Board members should document compensation decisions and know that they can support their decisions with data.

Some Examples

ERI’s Nonprofit Comparables Assessor software provides an easy way to find comparable organizations and compensation data.  Here are two examples:

Example: Small Day Care Center, located in Akron, Ohio

NTEE: Youth Development Organizations

Size: Annual revenues of $2 million (range of $1-5 million)

Geographic Location: Akron, Ohio (state-wide labor market)

Job Title: Executive Director

The data show that, in the state of Ohio, an Executive Director of similarly-sized youth development nonprofits is typically paid between $78,000 and $116,000, with an average of about $92,000.  The Nonprofit Comparables Assessor also provides a list of the organizations that meet the criteria so that the most relevant can be selected for further analysis, ensuring comparability of the data.

Example: Large Hospital, located in Chicago, Illinois

NTEE: Hospitals

Size: Annual revenues of $2 billion (range of $1-3 billion)

Geographic Location: Chicago, Illinois (US-wide labor market)

Job Title: CEO

Most CEOs in similar hospitals across the US typically earn between $897,000 and $1,652,000, with an average of about $1,183,000.  A more detailed look at the data will reveal which hospitals provide the most relevant comparisons for the salary decisions.

While these averages can give the board members some boundaries and a context for compensation levels, more detailed review and discussion of all factors is needed to finalize compensation decisions.

What Matters in Setting Nonprofit Executive Compensation

Boards setting nonprofit CEO compensation have a lot to consider – they need to set salaries that attract and retain the leaders needed by the charity and also fulfill their fiduciary responsibilities to allocate the charity money wisely.  At the same time, they must be compliant with IRS regulations on “reasonable compensation” (and perhaps state regulations) with an awareness of the potential for public scrutiny.

Research on compensation concludes that, for any given job, the level of pay is influenced most by “where” the job is done – and “where” most often means (1) the size of the organization; (2) the type of organization; and (3) the geographic location.

In the nonprofit sector, the IRS focuses on preventing “excess compensation” and defines “reasonable compensation” as “an amount as would ordinarily be paid for like services by like enterprises under like circumstances.”  This again is the concept voiced by compensation professionals in all sectors — pay is based on what you do and where you do it.  The IRS clearly wants nonprofits to consider the influence of organizational characteristics when collecting comparative data for a given job.

Size of Organization

Using ERI’s Nonprofit Comparables Assessor, the table below was created to illustrate the impact of size on compensation. Compensation ranges for the CEO of a human services organization of varying sizes (as defined by annual revenues reported on the Forms 990) are shown.

This illustrates how the size of annual revenues affects salary levels. So, should the human services organization with annual revenues of $10 million pay its CEO about $175,000?  Not so fast.

Type of Organization

The next factor to analyze is the influence of the types of organization – what services are provided in what field?  Organizations of similar size, using $10 million for this example, reveal wide differences in pay. This analysis, based on compensation reported by nonprofits on their annual Form 990 returns filed with the IRS, is easily generated by ERI’s Nonprofit Comparables Assessor.

This seems to indicate that the CEO of the $10 million human services organization should be paid around $146,000, rather than $175,000.  But, at least one more factor should be reviewed.

Geographic Location of Organization

What other similar organizations (human services with annual revenues of $10 million) are paying their CEOs in different geographic locations also should be reviewed.

So, the location of the $10 million human services organization is also important in setting salaries.  As shown above, this CEO would expect an annual salary of around $144,000 if the organization was in Pennsylvania, versus $154,000 if the job was in California.

Other Considerations

In addition to the major influences on compensation shown above, there are some other factors that might need consideration:

  • Other comparable organizations from other sectors.   While nonprofit data may be the most likely source of comparable information, salary information from government or even for-profit companies could be relevant for certain positions, where a candidate might have or need experience from other sectors.
  • Salary relationships within the organization.  Setting a salary using other outside organizations may require adjustments to salaries for other positions within the organization.  The spread between the CEO salary and the salaries of other employees may be important to recruiting and keeping a qualified committed workforce.
  • Budget constraints.  The Board members setting the salaries are responsible for the budget for the organization (including the CEO salary), so salary increases must be planned in a manner not to cause financial stress.

While IRS Instructions for the Form 990 will give the requirements (page 68 covers “reasonable compensation”), there is a lot more to determining nonprofit compensation that is not too high and not too low.  ERI’s Nonprofit Comparables Assessor easily provides the compensation data from comparable organizations that can help in that decision.


supplemental pay practices

Planning 2017 Salaries for Nonprofit Organizations

So the annual pay increase surveys are out, predicting average raises of about 3% – pretty much the same as in the past several years.  How helpful is this average when considering pay levels for a specific organization?  While it might be simple to just add a percentage increase to all current salaries, that approach is not the way to maximize the effectiveness of payroll dollars, particularly in the nonprofit sector.

Compensation Philosophy Is Key

Especially for nonprofits, defining a compensation approach is important – the salaries for executives are public information (reported on the IRS Form 990 every year), and there are many stakeholders who take an interest. Setting pay close to what other similar organizations pay for similar work not only fulfills the IRS and state charity regulators’ requirements, but also provides a basis for responding to questions from the media, funders, clients, and charity watch groups.

But that is not the only reason to do research on market compensation.  If market compensation levels are in place for an organization, then candidates will more likely be attracted to apply for vacant positions and stay with the organization. Paying less than what the job is worth typically leads to difficulty hiring and retaining the talent needed.  On the other hand, paying too much means that valuable and limited charity resources could be more effectively used.

Using Data from Comparable Organizations for Executives

The process is all about determining what is comparable.  Research has shown that the most influential factors in determining executive compensation are “size” and “industry.” In the nonprofit world, the “size” factor is revenue reported on the Form 990, filed annually by all tax-exempt organizations with the IRS; the “industry,” is subsector, as indicated by a National Taxonomy of Exempt Entities (NTEE) code, the nonprofit classification system created by nonprofit experts and practitioners.

ERI’s Nonprofit Comparables Assessor (CA) provides easy access to the Form 990 compensation data, allows the user to see how similar organizations pay their executives, and calculates reasonable compensation for an organization based on a specific type, size, and location.

CA asks the user to select a specific type of nonprofit, a revenue or asset size, and a geographic location (all US, one state, or selected states or even ZIP codes) and then calculates what expected pay would be for the job in such an organization.  For example, the table below shows the expected direct compensation for the CEO of an arts organization with $10 million in annual revenue in New York, with CA using data reported in the Forms 990 of organizations meeting the selection criteria.

Reportable Compensation for CEO of Arts Organizations in New York

Sample from ERI’s Nonprofit Comparables Assessor™

So, if the CEO compensation in this arts organization is paid around or less than $230,000, there will probably be few questions about reasonable compensation from those reviewing the compensation levels. However, if the pay is much higher, perhaps more than $290,000, additional data and a description of the rationale for paying at the higher-than-expected level might be needed.

Next, a review of more detailed data of very similar arts organizations, perhaps 10 to 15 should be done. ERI’s CA easily generates a list of all organizations that meet the selected criteria, and then the user can select the closest in size, geography, and mission.  For example, the table below shows five arts organizations with revenues of about $10 million in New York State, with CEO salaries ranging from $118,000 to $254,000.

Comparable Peer Analysis Table – Partial List

Sample from ERI’s Nonprofit Comparables Assessor™

Obviously there are big differences in what organizations similar in type, revenue size, and location pay their top executives.  The search could then be narrowed to a more specific type of arts organization, such as theater versus art museums or a smaller geographic area, such as New York City or Rochester versus the entire state.  Another factor to consider for an art organization might be asset size, as the table shows a huge range of assets for this partial list of comparables.  Because of the range of pay shown above, it is necessary to show why some are more relevant than other when determining which organizations are comparable.

ERI’s Form 990 library gives access to all Forms 990 so the source document can be used to learn more about organization functions and compensation details.

Finding Comparable Data for Jobs Not Reported on the Form 990

So the executive compensation data are available, using the CA to access Form 990 data. What about wage data for non-executive jobs, such as office manager, the accountant, and the security guard? The market pay for jobs such as these is influenced more by job duties and years of experience than by whether the employer is a nonprofit, a for-profit company, or a government.  Often, the skills and experience required are transferable among the three sectors.  The size of the organization, whatever its type, also has less influence on salary levels.

ERI’s Salary Assessor (SA) provides market rates for these staff-level positions.  Subscribers can access salary data for 7,000 positions (data are from all types of employers) in over 9,000 locations in the US, Canada, and Europe.  The user can select a geographic area and industry and then quickly create a list of competitive rates based on data for these staff jobs from all types of employers.  Setting pay based on market levels helps to reduce costly turnover and provide comparable information for an organization during salary negotiations.  SA can provide information for a smaller geographic area (e.g., New York City, Rochester, etc.) and also list detailed pay differences based on years of experience.

Benchmark Listing of Positions – Annual Pay Average in New York State

All Compensation Decisions Based on Comparable Data

Although the idea of simply applying an across-the-board increase to current compensation levels is appealing, it won’t meet the federal and state regulations on setting pay in the nonprofit sector.  Charity regulators could allow big increases but they require data to support that the compensation level as fair and reasonable and comparable.  Market-based compensation decisions are required for nonprofit organizations when executive compensation is set – the same type of research is also needed for the nonexecutive jobs so that all employees are compensated like employees in similar situations.  Check out ERI’s Nonprofit Comparables Assessor and Salary Assessor to see how easy it can be to benchmark and document compensation for all types of jobs in nonprofits.

IRS Sets Nonprofit Organization Work Plan for 2017

The recently released IRS Tax Exempt and Government Entities FY 2017 Work Plan contains little news but does reiterate its focus on data-driven enforcement activity for those concerned about compliance in the nonprofit sector.

Last year’s plan (FY 2016) for the Exempt Organizations (EO) Examinations section was to develop “an overarching compliance strategy to ensure organizations enjoying tax-exempt status complied with the requirements for exemption and adhered to all applicable federal tax laws.”

So EO implemented a data-driven case selection process to identify and address existing and emerging high risk areas of noncompliance, looking specifically at the following issues:

  • Exemption – Nonprofit purpose?  Private inurement?
  • Protection of Assets — Self-dealing?  Excess benefit transactions?  Loans to disqualified persons?
  • Tax Gap – Correct employment tax paid?  Liability for unrelated business income tax?
  • International — Funds spent outside the US?  Organizations operating as foreign conduits?  Compliance with Report of Foreign Bank and Financial Accounts (FBAR) requirements?
  • Emerging issues – Including non-exempt charitable trusts and IRC 501(r).

As Virginia Gross, a member of an IRS advisory committee, put it (see interview), this means a greater use of technology to review returns and less discretion for IRS – leading to a much more automated exam function.  All Forms 990 will be run through a system of close to 200 queries, designed to surface potential compliance risks. Based on the answers, the IRS will identify the organizations that are more at risk for noncompliance and investigate them further.

In FY 2017, the IRS will continue to review how noncompliance issues are identified, making filters more robust and improving statistical modeling.  It is all about the data reported on the Form 990 and to other parts of the IRS – they are going to be checked for consistency and accuracy.

The plan calls for IRS to focus on 400 Forms 990 that have been identified as high risk for private inurement and private benefit issues and 100 Forms 990-PF (private foundation returns) with anomalies detected.  A statistical sampling methodology to assess compliance in the Exempt Organizations population is under development, with the goal of an ongoing rolling statistical sample of 501(c) (3) and 501(c) other organizations to track the effectiveness of compliance efforts.

The IRS will also be increasing the amount of technical and procedural information available to the nonprofit sector by creating “issue snapshots” – short analyses on specific issues.  This is clearly a work in progress.

The bottom line for exempt organizations is clear – be very careful when answering questions on the Form 990 and make the answers accurate and consistent.  Be sure to complete any other required parts or schedules if there is a question that then requires a schedule or another part of the form to be filled out.  There are no changes to current laws and regulations – just a much higher level of scrutiny of the Forms 990, as the IRS continues the shift to data-driven decision making to guide its compliance efforts.

Charity Navigator’s Report on Nonprofit Executive Compensation

Charity Navigator (CN) recently published its tenth Charity CEO Compensation Study, stating that it is “designed to serve as a tool for board members seeking benchmarking data and for donors who want to gain a better understanding of nonprofit compensation practices.”  But the data won’t be of much use to many who are tasked with setting nonprofit executive compensation.

Which Charities Are Included in the Report?

The answer is probably not as many as you would think – of the 1.5 million charities registered with the IRS, Charity Navigator looks at about 4,500.  CN requires that charities meet a number of criteria to be included:

  • Reporting at least $500,000 in public support and more than $1,000,000 in total revenue for the two most recent fiscal years.
  • Reporting at least 1% of expenses allocated to fundraising and 1% of expenses allocated to administrative expense for three consecutive years (showing a commitment to raising funds from the public and providing appropriate infrastructure for the charity).
  • Not a hospital and not a university, college, or private elementary or secondary school (because they generate revenue almost entirely through program services).
  • Not a land trust, sorority and fraternity foundation, community foundation, or donor advised fund (because revenues and expenses fluctuate widely from year to year).
  • Not a foundation spending assets for grants and programs (since this type of charity does not raise money from the public).

What Are Charity Navigator’s Findings?

Median total CEO compensation is $123,462 in 2014.

  • This median includes data only from the 4,500+ charities that meet CN’s criteria.
  • ERI’s Nonprofit Comparables Assessor (CA) uses Form 990 data from all filers, representing well over 100,000 tax-exempt organizations that report compensation for their executives.
  • CA allows the use of criteria to limit the comparable organizations included in the calculation; these criteria – type of organization, size, and location – are what the IRS uses to assess the relevance of comparable data.

Median CEO compensation increases 3% from 2013 to 2014.

  • CN only uses data for the 3,452 charities that reported the same person as CEO for both 2014 and 2013.
  • What is relevant to the IRS when reasonableness of compensation is assessed is what executives are earning when compared to those in comparable organizations.  An overall median increase for a very limited group of incumbents is not likely to be very useful.
  • A median increase from 2013 to 2014 is not very useful to consider when setting compensation to start January 2017.

The largest driver of CEO salary is overall expenses. The charity’s mission (category) and location also play a role.

  • These criteria are of course those used by the IRS to determine the comparability of information used for comparison.  ERI’s research has also shown that size is the most influential factor in compensation levels.
  • ERI’s Nonprofit Comparables Assessor allows the user to calculate expected compensation by type of organization, by size, and by geographic location.  Using all three criteria yields a list of the organizations that the IRS would consider comparable data in the estimate of reasonable salary – just what the IRS wants to see.

Is the Report Helpful or Not?

As discussed above, the organizations included in this report represent a relatively small group of tax-exempt organizations.  In fact, many of the largest charities that include the highest paid executives (think foundations, hospitals, and universities) are not represented.  Users of this information should carefully consider its relevance.

Does a 3% median increase for CEO incumbents in 2014 over 2013 help to set salaries?  Not really.  The data needed for comparison must be collected from similar organizations, and what is important is the salary actually paid, not the rate of increase.  The goal is to review how current pay aligns with salaries in comparable organizations.  Overall averages and medians always seem to be of great interest but are a poor basis to determine market rates that follow IRS criteria. See this blog post for a further discussion.

ERI would agree with one of the report’s conclusion – that most of the sector’s CEOs are paid very reasonably and the incidence of very high pay is unusual.  For a detailed breakdown of CEO compensation by size and type of organization that includes all organizations that file Form 990 and report compensation, see this whitepaper.

Reports that cover only limited groups of charities and use single criteria – type or size or location – should be used very carefully in salary determinations. ERI’s Nonprofit Comparables Assessor can provide a group of similar organizations selected from all organizations that file a Form 990 – and the resulting estimate of compensation and list of comparable organizations will be accepted by the IRS.

Charity Navigator Ranks CEO Compensation

Charity Navigator recently posted its 12th annual national study analyzing regional differences in the financial, accountability and transparency practices of the largest U.S. charities on its website.

The methodology involves compiling data from the close to 5,000 charities (about 62% of the total evaluated by Charity Navigator). The charities were assigned to 30 metropolitan areas across the U.S., and then the median value of a number of financial variables and the percentage of compliance for a number of accountability and transparency metrics are added together and ranked, within each area, as compared to the national median scores.  The point, according to Charity Navigator, is to “reveal possible differences in financial, accountability and transparency practices of the various philanthropic metropolitan markets.”

As one of the rating criteria is “CEO Compensation,” the first thought is that this might be an interesting source of comparative data on charity salaries. Here is a conclusion actually stated on the website:

“The fact that CEO Compensation tends to be greater in D.C. than Orlando is an important realization for the charities and donors in each of those cities. It doesn’t mean that D.C.’s charities are wasteful or poorly managed. Rather, it means that the cost of doing business in D.C. is greater. Recognizing these differences is essential to the effective management and evaluation of nonprofits.

There are many subjective decisions built into the dimensions and metrics used in this study, but, for this blog, let’s just focus on the usefulness of the compensation data presented. The table below shows the CEO compensation values for the two areas mentioned in the quote from the study above.

The medians are calculated using widely varying numbers of charities, characterized only as “large.”  It is widely recognized that one of the characteristics most influential on salary levels is size of organization — the larger the organization, the higher the salary. So without more information on the sizes of the charities used to calculate the medians within the geographic areas and with the number of charities included ranging from 684 in D.C. to 53 in Orlando, there could be many reasons for variation in the medians for these regions.

Although there is general information provided on the type of charities in each metro area, a breakout by type is not available for the median calculation.  This could also have a major impact on the resulting median.  For example, hospitals and universities tend to be among the largest and highest paying organizations; so, if there are many more in D.C. than there are in Orlando, the medians will not yield an “apples to apples” comparison – rather a “fruit salad” approach.  Without some kind of statistical method to adjust for different sizes and types of organizations, one should be wary of drawing any conclusions about the reasonableness of CEO compensation in a given area.

Finally, there is no evidence presented to support the conclusion that the difference in CEO compensation is because “the cost of doing business in D.C is greater.”  The criteria listed do not appear to include any measures of the cost of doing business – so this statement seems purely speculative.

So let’s review what the IRS requires when charity CEO compensation is determined – that is, comparisons of salaries in similar organizations (similar in size, similar in type, and maybe similar in geography).  ERI’s Nonprofit Comparables Assessor can be used to easily find that group of similar organizations, using the size and type criteria – and the resulting comparable data will be accepted by the IRS.

The table below shows the average compensation for a specific type of charity, Human Service Organizations, of different sizes (based on annual revenues), in the two locations, compared with the U.S. national average.  This is the type of detailed data that is needed to determine reasonable compensation.

Although Charity Navigator offers its 2016 Metro Market Study as “another valuable resource to help you make informed giving choices and learn more about the charities in your community,” let the user beware!  Check out ERI’s Nonprofit Comparables Assessor.

Impact of Record-High US Giving on Charity Executive Compensation

The Indiana University Lilly Family School of Philanthropy’s recent report Giving USA 2016 found that American individuals, estates, foundations and corporations gave an estimated $373.25 billion to charities in 2015, reaching a record level for the second year in a row.  Total giving grew 4.1% in current dollars (4.0% when adjusted for inflation) in 2015 over 2014.  With size of revenues as a major influence on executive compensation levels, some might think that those who lead the charities may be in for increases.

Some Necessary Details

A more nuanced look at the annual giving report includes the following:

Almost $265 billion of all dollars given comes from living individuals – that is, 71% of the total; the increase from 2014 is 3.8%.

  • $58.5 billion, from foundations, about 6.5% higher than in 2014.
  • $32 billion from charitable bequests, an increase of 2.1% over 2014.
  • $18.5 billion from corporations, about 2.1% over 2014.

Average increases in giving are misleading – different types of charities received different amounts of donations.

  • Religious organizations received the most – 32% of the total giving — and over $119 billion, but less than a 2% increase from 2015
  • Education — $57 billion, up 9% from 2014
  • Human Services — $45 billion, up 4.2%
  • Foundations — $42 billion, almost a 4% drop from 2014
  • Health — $30 billion, up 1.3%
  • Public-Society Benefit — $27 billion, up 6%
  • Art/Culture/Humanities — $17 billion, up 7%
  • International Affairs — $16 billion, up 17.5%
  • Environment/Animals — $11 billion, up 6.2%

In addition, $6.6 billion went to individuals, mostly in-kind donations of medicine from the patient assistance programs of pharmaceutical foundations.

Impact of Increased Giving on Compensation

While the overall totals for giving look robust, again, a more detailed analysis shows the variety within the charitable sector.  The increase in giving is certainly not evenly distributed among sources.  For example, while many may think that most nonprofits are supported by foundation grants and corporate gifts, most charitable dollars given come from individuals – 71% of the total, in fact.  Human services organizations, the ones that first come to mind when most people think of as “charities,” received $45 billion in 2015, or only about 12% of the total given.

The second issue to note is that different types of charities receive widely varying amounts of support from giving. For many, gifts and donations are not the major source of revenues, as they receive payment for services (for example, individual patient and Medicare payments to nonprofit hospitals, college tuition to private universities, and parent payments for nonprofit child care).  And often social and health services paid for with public dollars are provided through contracts with nonprofits (such as foster care, mental health counseling, and services for the disabled).  Most of their revenue is from government contracts, not donations.

Conclusion

So, as usual, generalizations do not work well in the charitable sector.  It cannot be assumed that if US giving increases, then all charities will experience growth in revenues – there are wide variations among types.  As noted above, the amounts given to different types of charities are very different.  Then, the fact that the proportion of the total revenues that charitable giving represents is very different for different types of operations.  When tasked with determining appropriate compensation for charity executives, averages just do not work.  Data from similar organizations (same type of service, comparable revenue or asset size, relevant geographic location) is definitely required.  Compensation must be reasonable, not only to meet the IRS requirements to also to make donors comfortable with donations that they may make to the organization.  Finding that comparable data and determining what nonprofit executives in similar organizations are being paid are the functions of ERI’s Nonprofit Comparables Assessor.