2020 global salary increase

2020 Global Salary Increase Infographic

A global salary increase will affect the countries listed in the infographic below.

These 2020 salary increase projections are based on ERI Economic Research Institute’s extensive database, plus global historical trends and projections. This review assessed data from governmental resources, publications, and over 20,000 companies.

Want more information related to planning next year’s pay? See how ERI’s Global Salary Calculator Software can help you with your salary and compensation planning.

Try a FREE Demo
compensation forecasting

Compensation Forecasting – An Analysis of Salary Increase Trends

Compensation forecasting is vital for a company’s success; to meet and exceed revenue goals, you need insight on trends and how increasing rates can affect your budgets.  It can be overwhelming, especially if you do not have a salary forecasting tool with scientific data to back it up.

If you’re looking for information on salary increases and compensation trends, ERI’s National Compensation Forecast white paper can point you in the right direction. Each quarter, ERI examines the rates at which salaries have increased and provides guidance on expected increase for the months ahead. Review how national compensation has changed historically and see projected annual growth rates among various occupations, including Health Care, Sales, and Information Technology.

compensation forecast

The second quarter of 2019 continued to see salary increases at rates higher than expectations. Specifically, between April 1, 2019, and July 1, 2019, salaries increased at a rate of 0.68%. This rate is higher than the 0.56% expected quarterly growth rate. Furthermore, an unemployment rate of 3.6% points towards a tighter labor market with greater competition.  Overall, ERI is expecting compensation rates to continue growing through 2019.

For a more in-depth analysis, including mean salary growth charts, see ERI’s recent whitepaper, “National Compensation Forecast – July 2019.”

The data contained in the National Compensation Forecast is derived from ERI’s Salary Assessor and ERI’s Salary Increase Survey & Forecast. It’s designed to capture salary changes across a broad range of jobs found in the United States economy and provide a clearer picture of how compensation is growing.

Looking for more information?

Detailed salary data, including competitive salary levels and market benchmarks, can be found in ERI’s Salary Assessor.

ERI Economic Research Institute compiles the most robust salary, cost-of-living, and executive compensation survey data available, with current market data for more than 1,000 industry sectors.

ERI’s Assessor Series® – Solutions for every compensation decision

Try a FREE Demo Request a Guided Tour

compensation benchmarking

Compensation Benchmarking and the Role It Plays in the Hiring Process

What Exactly Is Compensation Benchmarking?

Compensation benchmarking is best defined as the process of applying external market data to make fair and competitive compensation decisions.  It may even influence strategy, policies, and practices.  When compensation benchmarking is effectively used, companies can then attract top talent and pay competitive compensation rates, while maximizing their budget.


The Benefits of Compensation Benchmarking in the Hiring Process

  • Finalizing New Hire Compensation Packages: By referencing similar jobs in companies within the same industry, geographic location, and size (e.g., revenue for management jobs), your company is more likely to attract qualified talent using competitive market rates. Here’s an example of how market data can be used to set a new hire compensation package:

A screen shot is provided below for a Buyer with 8 years of experience in Chicago, IL, in All Industries—Diversified.  The report indicates a median base pay of $74,895.

compensation benchmarking

  • Avoiding Loss: Labor is typically the largest expense within a business and impacts an organization’s ability to attract and retain top talent.  Obtaining reliable, accurate market data is critical to an organization’s bottom line.

For example, if a business pays $10,000,000 in annual compensation expenses, being just 1% over the competitive labor market may result in additional costs of $100,000 or even more.  Also, the high cost of voluntary turnover can be controlled through market-competitive pay rates.  These are just two examples. The cost of a quality salary survey will clearly pay for itself through the results achieved.

  • Formalizing Job Descriptions: Formal job descriptions allow your organization to accurately match jobs in your organization to survey data. These descriptions are also the first pieces of information that potential new hires will come across during the staffing process. Taking the time to formalize your job descriptions will ensure that you are comparing apples to apples when you benchmark your jobs. Furthermore, defining the primary purpose, essential functions, basic and preferred qualifications, and work environment sets the precedent for what is to be expected from a potential employee. This not only supports in hiring the right employee, but also plays an important role in on-boarding, training, and performance management.


Whether you are in the process of hiring new employees or restructuring your current pay strategy, implementing compensation benchmarking will result in a more accurate and effective solution. In addition to avoiding many of the negative effects of over- and under-paying, such as external or internal inequity, organizations will experience many of the benefits of market competitive compensation, including a healthy turnover rate, a fair and competitive budget, a positive working environment, and increased employee engagement.

ERI Economic Research Institute compiles the most robust salary, cost-of-living, and executive compensation survey data available, with current market data for more than 1,000 industry sectors.

ERI’s Assessor Series® – Solutions for every compensation decision

Try a FREE Demo Request a Guided Tour

Examining Cost-of-Living Differentials at Different Earnings Levels

Relocation and HR Professionals using the Relocation Assessor frequently ask, “Why does the cost-of-living differential change when I increase or decrease the Annual Earnings? Shouldn’t it always be a fixed percentage?” To evaluate COL differential estimates, it is necessary to have an understanding of the underlying expenditures patterns. Since the mid-1980s, the Bureau of Labor Statistics using the annual Consumer Expenditure Survey has produced average expenditures for various family profiles (e.g., earnings level, age, and race).  Survey participants are asked to keep detailed diaries of all spending, and in-person interviews are conducted. The goal is to accurately capture both reoccurring purchases (such as grocery items) and larger expenditures over a period of time (such as a car, rental/mortgage payment, etc.).  Results from the survey demonstrate that, at lower earnings levels, it takes a larger percentage of Annual Earnings to cover the expenditures for Housing, Consumables, Transportation and Health Services for the professional/mid-management lifestyle estimated in the Relocation Assessor data.

Another (more mathematical) way to think about this is that more and more of the typical expenditures are being covered as Annual Earnings increase, so more is available for the Miscellaneous expenditure category. The Relocation Assessor assumes that the Miscellaneous expenditures are equal in both the Base and Destination locations. The “mathematical” explanation follows:  The Miscellaneous category becomes a higher percentage of Annual Earnings as it increases. The COL differential of Miscellaneous is always 0, so an increasing percentage of entire budget is not impacted by a COL differential.  Now consider the “intuitive” explanation:  Does it make sense to offer the same COL differential percentage to an employee making $50,000 as an employee making $500,000?

In the example below, we illustrate with a 900 square foot apartment rental at an Annual Earnings level of $75,000 for a family of two. The COL differential from Atlanta to San Francisco is a 51.7% COL increase. For the same parameters (900 square foot apartment rental and family size of 2), when the Annual Earnings increases to $125,000, the COL differential decreases from 51.7% to 34.3%. If the Annual Earnings is $200,000, then the differential falls to 26.5%.

Here is the generalized explanation:  Expenditure patterns differ based on earnings levels. At lower earnings levels, households typically spend a higher percentage on Housing and Consumables. Further, as income increases, the percentage of Income and Payroll Taxes increase due to the progressive tax structure in the US.

In practice, the HR or Relocation Professional gets this common question from the recipient of a Relocation Assessor report: “I found different data online about the cost of living in my new location. Why is what I found so much higher?” Ask to be provided with the results (the COL differentials) from the source being for several different income levels (perhaps $50,000 and $500,000 in addition to the individual’s salary). If the percentage difference for both (all) salary levels is the same, share the above explanation.

ERI Economic Research Institute compiles the most robust salary, cost-of-living, and executive compensation survey data available, with current market data for more than 1,000 industry sectors.

ERI’s Assessor Series® – Solutions for every compensation decision

Try a FREE Demo Request a Guided Tour

Nonprofit Board Members – To Pay or Not to Pay in 2018?

The question of paying or not paying directors is a perennial nonprofit debate. The reasons cited by each side are discussed in a recent ERI white paper.

The vast majority of members of boards of directors in the nonprofit sector are not paid for their services. Board members typically serve on a part-time, voluntary basis, and many in the sector feel that they should not benefit personally from their service. While board members do fall under the IRS prohibition on “self-dealing,” there is an exception made for “payment of compensation … for personal services,” which includes fees for board members. Payments, however, must be “reasonable and necessary to carry out the exempt purposes” and “not excessive.” So, compensation is permitted – but it cannot be “unreasonable” and “excessive.”

Research Findings on Compensation for Nonprofit Board Members from ERI’s Form 990 Data

ERI has created a database of executive compensation data from IRS Forms 990, the annual reporting legally required from nonprofit organizations, used in ERI’s Nonprofit Comparables Assessor. This software program calculates average competitive compensation levels for the executive jobs reported on the Form 990, finding comparable organizations using the characteristics of revenue size, type of organization, and geographic location, deemed relevant by the IRS when it evaluates whether compensation is reasonable or not.

The ERI database includes almost 223,000 tax-exempt organizations. Observations were taken from each organization’s most recent Form 990 for 2015, supplemented with 2014 data if the 2015 form had not yet been processed. About 76% were charitable organizations, tax-exempt under IRC Section 501(c)(3). This group is the one of most concern, as the IRS regulations dealing with compensation issues contain penalties for excessive payments for charities. Organizations given tax-exempt status under 501(c)(4) add another 4% to the total of organizations covered by the excessive payments rules. Thus, about 80% of tax-exempt organizations should be aware that their compensation levels for board members, as well as executives, have to pass IRS scrutiny.

In summary, the Form 990 data analyzed by ERI reveal these findings:

  • Charitable organizations, exempt under IRC Section 501(c)(3), represent 76% of all tax-exempt organizations, and about 2% report paying their board members.
  • Some organizations exempt under other IRC subsections are slightly more likely to pay their board members (e.g., labor groups, life and mutual insurance companies, etc.), but the incidence of payment is still low; these organizations are not covered by IRS regulations that provide penalties for excessive compensation.
  • The charitable organizations most likely to pay board members are hospitals (5.4%), followed by universities (2.7%).

More details on the findings by type and size of nonprofit are available in the white paper, Nonprofit Board Members – To Pay or Not to Pay in 2018?

If an Organization Does Want to Pay Directors

Based on the ERI’s analysis of compensation for board members reported on the Forms 990, care must be taken to collect data that support compensation for board members and stand up to IRS scrutiny.

The organization’s culture, funds, members, and donor expectations, as well as the image it wishes to portray, will all factor into the decision whether to compensate board members. It is very important to pay careful attention to legal requirements and the details of any payment arrangements. ERI’s Guide to Setting Nonprofit Executive Compensation can also provide guidance to nonprofits setting compensation for executives and board members.

ERI Economic Research Institute compiles the most robust salary, cost-of-living, and executive compensation survey data available, with current market data for more than 1,000 industry sectors.

ERI’s Assessor Series® – Solutions for every compensation decision

Try a FREE Demo Request a Guided Tour

990 Electronic Filing

Another Attempt at Mandatory Form 990 Electronic Filing

The Form 990 the IRS annual reporting return that most tax-exempt organizations are required to file annually includes information on financial, programmatic, and executive compensation and is the most comprehensive and accurate source of data on the nonprofit sector.  Although a public document since its inception in the 1940s, the forms until recently have only been available after a long IRS processing delay and then not in a machine readable format.  That may now be changing.

The U.S. House Ways and Means Committee has released a discussion draft of a bipartisan bill that includes mandatory Form 990  e-filing. Sponsored by Oversight Subcommittee Chairman Lynn Jenkins (R-KS) and Ranking Member John Lewis (D-GA), this is part of a larger IRS reform effort.

The bill would require any organization that files a Form 990 to file in electronic form and for all electronically filed returns to be made available to the public in machine-readable format, beginning the taxable year after the date of the law’s enactment.  If an organization feels this would be an undue burden, there is a process for the Secretary of Treasury to provide up to a two-year delay of the e-file requirement.

This bill is the most recent effort to make e-filing mandatory and to make the data available in a usable format.  Currently, approximately 60% of Forms 990 are electronically filed and available free on Amazon Web Services.  This legislation would expand e-filing, to complete the searchable database with all Forms 990 filed by the nonprofit sector.

This proposed legislation represents progress on mandatory Form 990 e-filing, but this has been a very long road so far.  Past blogs have discussed what appeared to be promising developments, as in these examples:

  • The Federal Budget proposals for the last several years have included mandatory Form 990 e-filing.
  • A Federal District Court ruled that the IRS had to provide computer-readable data for some organizations that e-filed their Form 990 data.
  • The Government Accountability Office (GAO) recommended that Congress expand the mandate for electronic filing of nonprofit tax forms, concluding that this would result in more accurate and complete data becoming available sooner, which, in turn, would allow the IRS to more easily identify areas of non-compliance.

Hence, Form 990 e-filing seems to have widespread support, including bi-partisan legislative and IRS support.  On April 17, the House of Representatives actually passed this legislation, so it will now go on to the Senate for consideration.  The nonprofit sector itself has been on record as supporting e-filing for years.  Even a federal court has ruled that e-filed data must be available to the public.  But why hasn’t it happened?

The IRS has consistently responded that it doesn’t have a sufficient budget to pay the administrative costs involved – in fact, Congress has actually decreased its budget in recent years.  Yet, after the federal court ruling, the IRS did make the e-filed Form 990 data available through Amazon Web Services.  However, the data feeds have been irregular in timing and size over the year and a half since this process started.  It is difficult for users to plan, not knowing when and how much data will be available.  Also, the data from Amazon only includes the currently e-filed forms, about 60% of the total. 

The proposed bill includes what the nonprofit sector wants and needs, but what are the chances that this bill will become law?  There is little opposition to the concept – just not enough positive support currently, and it is part of a larger bill with an uncertain future.  Stay tuned!

ERI Economic Research Institute compiles the most robust salary, cost-of-living, and executive compensation survey data available, with current market data for more than 1,000 industry sectors.

ERI’s Assessor Series® – Solutions for every compensation decision

Try a FREE Demo Request a Guided Tour

2020 Payroll Tax Increase

Tax Reform Hits Compensation of Nonprofit Executives in 2018

Effective January 1, 2018, the Tax Cuts and Jobs Act, otherwise known as the Tax Reform bill, imposes a new 21% excise tax on nonprofits that pay compensation of $1 million or more to any of their five highest-paid employees.  There will also be a tax on certain employee benefits.

As usual, check with a lawyer with expertise in nonprofits for the details, but the basics of the changes follow:

  • Tax is paid by the exempt organization and applies to all remuneration of a covered employee (including non-cash benefits), except tax-qualified retirement plans, amounts that are excludible from the covered employee’s gross income.
  • Any portion of compensation paid to a licensed medical professional (e.g., doctor, nurse, or veterinarian) which is for the performance of medical or veterinary services by the professional is excluded.
  • Payments from related organizations and governmental entities are also included – those entities pay their pro rata share of the tax.
  • If an employee qualifies as a covered employee for any year, the excise tax applies to compensation in excess of $1 million and certain parachute payments paid to the person by the organization in any future year.

Nonprofits were unable to plan ahead for the impact of this change – the period to qualify as a covered employee began in tax years beginning in 2017, so the tax on compensation over one million dollars will be due in 2018 for tax-exempt organizations.

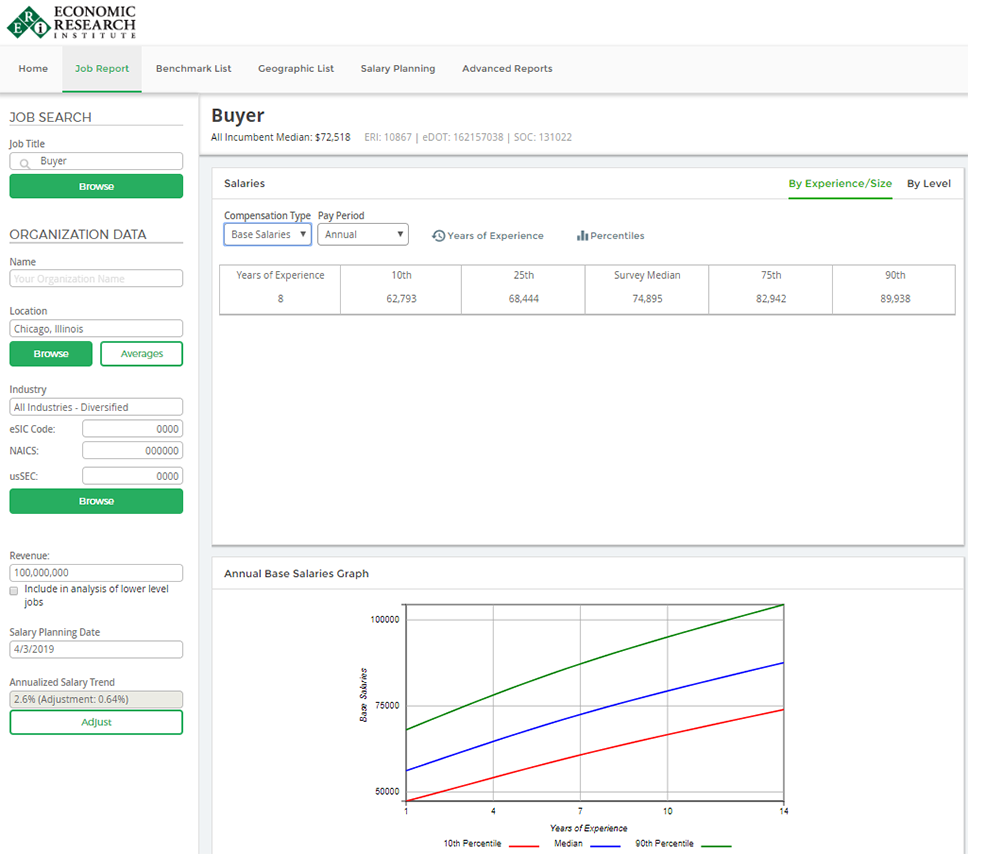
Set competitive pay for nonprofit executive compensation with ERI’s Nonprofit Comparables Assessor. Learn more and try a free demo today.

Why This Change?

This approach is actually portrayed as an attempt to provide parity with the deductibility of executive compensation for publicly-traded for-profit companies.

Prior to tax reform, such corporations could only deduct salaries up to $1 million dollars for their five highest-paid officers as expenses. But performance-based pay, like bonuses and stock options paid according to a transparent formula and disclosed to shareholders, was exempt from the calculation.  Compensation packages in businesses then tended to shift to pay based on reaching revenue or stock price goals, away from guaranteed base salaries. The tax reform bill removed the exemption for performance-based earnings.  Now all income (effective for amounts paid or incurred after December 31, 2017) for publicly-traded private company executives over $1 million will no longer be deductible as expenses.  The Joint Tax Committee expects the new provision to raise $9.2 billion over 10 years.

In applying this excise tax to nonprofit executives, the Ways and Means Committee Majority Tax Staff also raised the idea in its summary that highly paid nonprofit executives actually divert resources from exempt purposes.  It states that exemption from federal income tax is a significant benefit for tax-exempt organizations, making the case for discouraging excess compensation paid out to such organizations’ executives perhaps even stronger than it is for publicly traded companies.

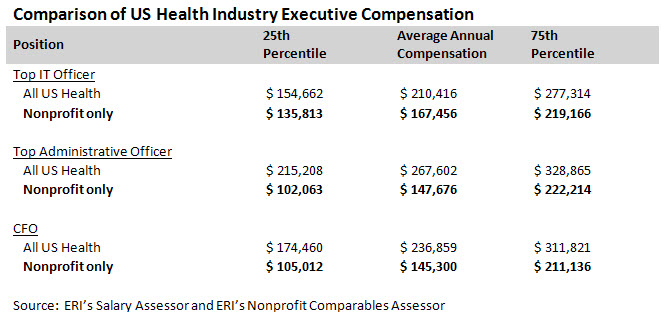
In fact, an analysis of Forms 990 for approximately 100,000 organizations filing the annual report to the IRS in 2014 published recently by the Wall Street Journal found 2,700 nonprofit officials were paid more than $1 million.  Although most were administrators at hospitals and universities, there were also many football coaches and executives at endowments like the Harvard Management Company.  Nonprofit organizations respond that they are trying to attract the best candidates and are merely adopting compensation practices similar to those in the private sector.

You can use ERI’s Nonprofit Comparables Assessor to determine the ‘.pay of nonprofit executives using data from Forms 990.

Taxing Fringe Benefit Expenses and Termination Pay

The Tax Reform Bill subjects tax-exempt organizations to Unrelated Business Income Tax (UBIT) on the value of certain employee fringe benefits, including transportation, parking facilities and on-premises athletic facilities. This is again attempting to treat nonprofit executives the same as those in taxable corporations.  Moreover, the provisions go into effect immediately – for all amounts paid or incurred after December 31, 2017.

A nonprofit organizations is also liable for the excise tax if payments made in connection with a termination of employment to any of its top five most highly compensated executives equal or exceed three times the executive’s average earnings over the preceding five years.

The Impact – Still to Be Determined

In the world of large public companies, wages has not been limited to a million dollars just because the deductibility of the expense was not available.

But this will be a significant change for the nonprofit sector, not only because it adds an unexpected expense to nonprofit payrolls, but also because it modifies the procedures that have regulated excessive salary levels for the past two decades.

While nonprofits will now face the same limit on compensation as for-profit corporations, there will clearly be some initial problems.  Most of the executives receiving more than $1 million have employment contracts, and the organizations will be bound by contract to pay them.  However, an additional 21% to be paid in taxes was not provided in the budget, so that will have to be covered somehow for 2018.  In the longer term, either nonprofits will pay less and risk losing executives to for-profit competitors who can pay more, or they will maintain the income levels and incorporate the excise tax into their budgets.

Under the existing rules for compensation, executive compensation had to represent the reasonable value that would ordinarily be paid for like services by like enterprises (whether taxable or tax-exempt) under like circumstances.  The excise tax, if deemed “unreasonable,” was imposed on the person receiving the excessive payment.

While the tax reform bill doesn’t change this process, it certainly does suggest that any executive salaries above $1 million is unreasonable, as it is subject to the excise tax.  As the IRS makes the necessary changes in its regulations and forms to implement the new law, ERI will continue to track its impact on the levels of nonprofit executive compensation and the process of setting them. (Also see ERI’s Guide to Setting Nonprofit Executive Compensation. For further information, ERI has an upcoming webinar for Nonprofit Comparables Assessor training).

ERI Economic Research Institute compiles the most robust salary, cost-of-living, and executive compensation survey data available, with current market data for more than 1,000 industry sectors.

ERI’s Assessor Series® – Solutions for every compensation decision

Try a FREE Demo Request a Guided Tour

charity CEO salaries

How Many Charity CEOs Will Earn $1 Million or More in 2018?

A Wall Street Journal study published in March 2017 found that around 2,700 employees of 501(c)(3) nonprofits received annual compensation of more than $1 Million in 2014.  In 2011, a similar study found that about 2,000 were paid at this salary level, so the number increased about 30% over the three years. The number of employees receiving compensation in excess of $1 million will probably increase significantly in 2018.

The organizations that pay the most are the “meds and eds”—in fact, about 75% of the high-paid charity executives were working for healthcare systems and another 10% were with private colleges and universities.  These compensation levels could be (and have been) explained by the size of these organizations and the wide-ranging responsibilities that go with leading them.  Yet there were some exceptions, such as an online ministry with executives receiving $4 million in salaries.

But should there be concern about the proportion of the budget going to “charitable” programs and activities versus executive salaries, or the appropriate use of money that comes from donor contributions, direct government support, and tax support through the deductibility of charitable gifts?  The last few decades have seen increasing professionalization of nonprofit executive, leadership, and the sector has also recognized the need for nonprofits to compete for talent with the for-profit sector. Increasingly, nonprofit executive compensation looks more like for-profit CEO contracts, with a smaller proportion paid in base salary, and more executive compensation structures tied to achievement of performance objectives. The WSJ study of 2014 salaries reported on Forms 990 revealed that base pay of over $1 million was reported on only one-quarter of the executives; the rest had total compensation of more than $1 million when incentives were added.

Most of thenonprofit organizations paying individuals more than $1 million hired consultants when the board made the compensation decisions, much like for-profit corporations.  The IRS, which exercises oversight to ensure that nonprofit executive compensation is not “unreasonable,” actually encourages this approach, requiring total compensation that is in line with similar nonprofit—and for-profit—organizations.  The board must lead the compensation decision-making process and be able to show that data was used as a basis for the decision.  What is interesting is that nonprofits are learning what for-profits have known for a while—the use of such comparable salary data, may actually drive up compensation levels. After the data are collected and analyzed, who wants to be paid below the average for similar jobs in similar organizations?

Just a review of charity CEO salaries, however, is not helpful to a board when it makes its employee compensation decisions.  Again, such actions need to be in compliance with IRS rules and regulations, as detailed in ERI’s white paper entitled Guide to Setting Nonprofit Executive Compensation.  In summary, that means that total salaries and wages must be “reasonable”—an amount that would ordinarily be paid for the executive performing like-services by like-enterprises, whether taxable or tax-exempt, under like-circumstances.  Therefore, the board must follow these steps:

  • Document the decisions on compensation structure in the records at the time of approval by the full board.
  • Note the comparability data obtained, how it was obtained, and the actions taken to ensure that no one with a conflict of interest was involved in the compensation analysis decision.
  • If it is decided that a reasonable compensation level is higher or lower than the range of comparable data received, then the compensation benchmarking underlying the determination should be recorded.

Whether a consultant is used or not, ERI’s Nonprofit Comparables Assessor provides a simple and cost-effective way to collect and analyze the comparable salary data needed in that process.

ERI Economic Research Institute compiles the most robust salary, cost-of-living, and executive compensation survey data available, with current market data for more than 1,000 industry sectors.

ERI’s Assessor Series® – Solutions for every compensation decision

Try a FREE Demo Request a Guided Tour

IRS

IRS Plan for Nonprofit Enforcement in 2018

When the IRS issued its work plan for fiscal year (FY) 2018 in September, the nonprofit sector gained some insight into future enforcement and compliance activities.  Yes, the IRS cites reduced resources and staff, but intends to step up the use of data analytics and computer analysis to increase the effectiveness of its efforts.  The 16-page report, entitled “Tax Exempt and Government Entities FY 2018 Work Plan,” indicates that there will continue to be focused attention on data, and the data used will be from the Form 990 filed annually by-tax exempt organizations. It is clear that what is reported on the Form 990 needs to be consistent and accurate.

All Forms 990 are run through a system of hundreds of queries, designed to identify potential compliance risks. Based on the answers, the IRS will identify the organizations that are more at risk for noncompliance and investigate them further.

The IRS even created a new unit in May – the Compliance, Planning & Classification (CP&C) unit – specifically to identify, research, and monitor compliance risks, using data analytics. In FY 2018, an Internal Submission Portal will be added to collect or “crowdsource” any outside input on compliance – a place to submit names of organizations that warrant IRS investigation.

Focus for FY 2018

Some areas noted in the report as focus areas of compliance may be of particular interest to those setting compensation for nonprofits:

  • Supporting organizations – examine those that state they are supporting organizations and yet filed the Form 990-N (the IRS postcard version of Form 990 required of very small organizations)
  • Previous for-profit entities – review organizations that operated as for-profit entities prior to their conversion to IRC section 501(c)(3) organizations
  • Private benefit and inurement – scrutinize organizations that show indicators of potential private benefit or inurement to individuals or private entities
  • Private foundations – continue to examine private foundations based on potential anomalies found on their Form 990-PF filings
  • Referrals – continue to pursue referrals received from sources within and outside the IRS that allege non-compliance by an exempt organization

Checks for IRS-Required Filings on Wages and Benefits

When the IRS looks at compliance, organizations should be aware that certain checks are now standard procedure:

  • Combined Annual Wage Reporting (CAWR) employment tax – Do tax-exempt employers have discrepancies between the Form W-2 and Form 941/944 and what is reported on the Form 990?
  • Form W-2/1099 matches – Are there payments reported on Forms 1099 that should have been treated as wages subject to Federal Insurance Contribution Act (FICA) tax and income tax withholding?  Has the organization properly categorized staff as employees or contractors?
  • Models – Do the Form 990 answers show the characteristics that the IRS models identify as leading to the highest risk of non-compliance (such as substantial credit balances with no returns, for example, or zero to minimal Medicare and/or Social Security wages paid compared to Form 1099 distributions)?

The Bottom Line

So the IRS is still looking at Forms 990 and is continuing its increasing reliance on technology and cross checks with forms related to wages and benefits forms filed with parts of the IRS not related to tax-exempt requirements.  The bottom line for nonprofits is clear – be very careful when answering questions on the Form 990 and make the answers accurate and consistent.  Be sure to complete any other required parts or schedules if there is a question that then requires a schedule or another part of the form to be filled out.  There are no changes to current laws and regulations, just a much higher level of scrutiny of the Forms 990, as the IRS continues the shift to data-driven analyses to guide its compliance efforts.

ERI Economic Research Institute compiles the most robust salary, cost-of-living, and executive compensation survey data available, with current market data for more than 1,000 industry sectors.

ERI’s Assessor Series® – Solutions for every compensation decision

Try a FREE Demo Request a Guided Tour

compensation benchmarking

Attracting Nonprofit Executives in a Tight Labor Market

The recent Nonprofit Employment Practices Survey, published annually by consulting firm Nonprofit HR, found the following:

  • 50% of nonprofits were planning to hire new employees in 2017, down from 57% in 2016.
  • Among for-profit companies, 40% said they would hire in 2017, up from 36% in 2016.

With the US unemployment rate at a little over 4%, considered “full employment” by some economists, there is increasing competition between the nonprofit and for-profit sectors for employees.  The for-profit companies are also being much more aggressive about promoting the social aspect of employment as a recruiting technique.  Employees seeking a mission, the traditional nonprofit talent pool for nonprofits, can now find jobs in for-profit companies that may offer what they want – some paid hours for volunteering, a company commitment to a cause, etc.

Nonprofits face other barriers also – often no or limited recruiting budgets, little flexibility to negotiate higher salaries in a tight labor market, and poor communication about what it is like to work there.  This concept, called “employer branding”, has been very successfully done by companies such as Amazon, Google, and the Motley Fool.

With a tight labor market, nonprofits may need to make some changes to compete for employees.  It is not enough to rely on past good will and the words in the nonprofit’s mission statement.  Here’s what a nonprofit now needs to do:

  • Pay attention to organizational branding and its reputation as an employer.
  • Ensure that job candidates have positive contacts with the organization — quick responses to emails and calls, a welcome when they visit the office, and prompt follow-up with the status of the job search.  Job candidates who have a bad experience will spread the word.
  • Do research on competitive pay levels for positions and pay market rates.  Without appropriate pay in place, nonprofits will face difficulties in recruiting and retaining top candidates.

Competing with the For-Profit Sector for Talent

Boards setting nonprofit executive compensation have a lot to consider – they need to set salaries that attract and retain the talent needed by the charity and also fulfill their fiduciary responsibilities to allocate the charity money wisely.  At the same time, they must be compliant with IRS regulations on “reasonable compensation” (and perhaps state regulations) with an awareness of the potential for public scrutiny.

Research on compensation concludes that, for any given job, the level of pay is influenced most by “where” the job is done – and “where” most often means (1) the size of the organization; (2) the type of organization; and (3) the geographic location.

In the current tight labor market, a review of the additional factor of what comparable jobs pay in other sectors, such as government or for-profit companies, is becoming more and more relevant.  While nonprofit data may be the most likely source of comparable information, salary information from other sectors could be an influence on salary levels for certain positions, where a candidate might have or need experience from other sectors.  In fact, IRS regulations provide that some salary comparisons from other sectors can be used in the justification of “reasonable compensation” for a proposed salary in the nonprofit.  But, the IRS says not all comparative data can be from for-profit companies.

The health industry is one that includes employees in all three sectors – government, nonprofit and for-profits.  ERI’s Salary Assessor provides average salaries for positions based on data without regard for the type of employer.  For example, the average salary for a hospital administrator in the Salary Assessor would include observations from hospitals operated by various levels of government, by nonprofits, and by for-profit companies.   Compensation information for executives in nonprofit hospitals specifically is available from the Nonprofit Comparables Assessor, using the IRS Form 990 as a source.

To assess what this more competitive labor market might mean for nonprofits, let’s compare compensation data on some positions that could be found in the health care industry across the US.  Consider the positions of Top Administrator, the Top IT Officer, and the Chief Financial Officer (CFO) in entities with annual revenues of $25 million.  A comparison of average salaries using data from all types of health industry employers (from ERI’s Salary Assessor) versus nonprofits only (from ERI’s Nonprofit Comparables Assessor) indicates striking differences in pay.

The table below is based on data from health industry entities across the US with annual revenues of $25 million reported in ERI’s Salary Assessor and ERI’s Nonprofit Comparables Assessor.  The average compensation shown for “All US Health” includes compensation paid in cash only (base salaries plus cash bonus).  Thus, for-profit salaries may be understated because stock awards and options not available from governments and nonprofits could also be part of total compensation.

It appears that attracting talent to the nonprofit sector in a competitive labor market is going to be a struggle without adequate resources and increasing attention to marketing nonprofits as attractive employers.