
Looking to Benchmark Pay?
Merit Matrix
There are a wide variety of performance-based merit matrices.
Employee salary range placement and performance rating are combined in a merit matrix chart, as shown in the example below.
Pay-for-Performance Merit Matrix
| Performance Rating | First Quartile | Second Quartile | Third Quartile | Fourth Quartile |
|---|---|---|---|---|
| Outstanding (5) | 12% | 10% | 8% | 6% |
| Exceeds Position Requirements (4) | 10% | 8% | 6% | no increase |
| Meets Position Requirements (3) | 8% | 6% | no increase | no increase |
| Meets Minimum Requirements (2) | special consideration | no increase | no increase | no increase |
| Does not meet requirements(1) | no increase | no increase | no increase | no increase |
If you know an employee’s performance ranking and their position in range (quartile), you can then determine the amount of the merit increase based on the merit matrix.
Example: Eileen and Sam are both art handlers at the same art gallery in Santa Fe, New Mexico. Based on the following information and using the Pay-for-Performance Merit Matrix, we need to determine the salary increase for both Eileen and Sam.
Current Salary:
- Eileen: $48,000
- Sam: $43,000
Performance Rankings:
- Eileen: Exceeds Position Requirements
- Sam: Meets Position Requirements
Market Research Analyst Rate Range:
Salary Range: $35,000 - $45,000 - $55,000
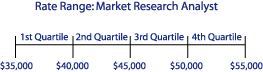
From the rate chart above, we can determine the quartiles for both Eileen and Sam.
- Eileen: 3rd Quartile
- Sam: 2nd Quartile
Now using the Pay-for-Performance Merit Matrix, we select the performance rating and the current salary quartile for both Eileen and Sam to determine the percentage salary increase for both individuals.
- Eileen: 6%
- Sam: 6%
Pay-for-Performance Merit Matrix
| Performance Rating | First Quartile | Second Quartile | Third Quartile | Fourth Quartile |
|---|---|---|---|---|
| Outstanding (5) | 12% | 10% | 8% | 6% |
| Exceeds Position Requirements (4) | 10% | 8% | 6% | no increase |
| Meets Position Requirements (3) | 8% | 6% | no increase | no increase |
| Meets Minimum Requirements (2) | special consideration | no increase | no increase | no increase |
| Does not meet requirements(1) | no increase | no increase | no increase | no increase |
Organizations will typically provide higher increases for higher performers who are lower in their salary range. This also results in lower increases for poor performers who are higher in their salary range.
Time-frame
The most common merit review cycle is 12 months.
Another method is to alter the time period between merit increases, such as giving increases to outstanding performers every 6 months, while granting average performers increases every 12 months, and reviewing lower performers’ pay at an 18 month review.
More refined charts
The previous sample merit matrix is a simple one. It allows for pay increases that vary only with performance and place in the rate range. Rather than having a set percentage increase, as illustrated, each of the boxes could have a range, say 6.5% to 8.5%. The example below displays a merit matrix which provides greater management discretion in administering merit increases.
Merit Increase Guidelines
| Up to Midpoint | Over Midpoint | ||
|---|---|---|---|
| Performance Rating | Occurrence | Merit Increase | Merit Increase |
|
5 - Far Exceeds Expectations Performance significantly and consistently far exceeds job performance standards. |
10% | 6.50% - 8.50% | 4.25% - 6.25% |
|
4 - Exceeds Expectations Performance regularly and consistently exceeds job performance standards. |
20% | 4.25% - 6.25% | 2.00% - 4.00% |
|
3 - Meets Expectations Performance regularly and consistently meets all job performance standards. |
55% | 2.00% - 4.00% | 1.25% - 3.25% |
|
2 - Sometimes Meets Expectations Performance is still developing or does not consistently meet job performance standards. Performance improvement or further development is needed. |
10% | 1.25% - 3.25% | 0% |
|
1 - Does Not Meet Expectations Performance does not meet performance standards of the job. Immediate corrective action required. |
5% | 0% | 0% |
| Merit Increase Budget | 100% | 3% | |
Memory Jogger
In a merit matrix chart, all top performers receive: