
Looking to Benchmark Pay?
Histograms
Once you have gathered your data, it's time to analyze it.
Histograms provide a graphical interpretation of the variation and center of a dataset.
Characteristics of a basic histogram are these:
- Can only be used for interval data.
- Shows the variations in the data, especially the range.
- Lets you identify patterns in the data such as overall shape of the data, symmetry, the location and spread, existence of outliers and evidence of clusters or gaps.
- Total area under the histogram is 100%.
- Percentage of items in an interval is given by the area of the region(s) over that interval, not by the height.
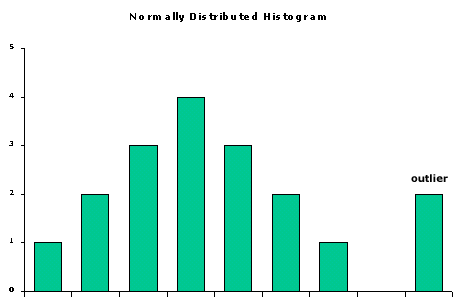
Here's an example of a histogram:
Distribution
One application of the histogram is to determine if a set of data is normally distributed. Since normality is a pre-condition for certain analyses of data, including many hypothesis tests, statisticians often rely on histograms as an initial test of the dataset.
Outliers
Histograms can also be used to identify outliers.
| Outliers | Observations that lie far from the main body of the distribution. |
Outliers may result from measurement errors (such as typing errors) OR from observations that are very different from the rest of the dataset.
Outliers must be treated with care. If the outlier is a result of a measurement error, it may be discarded from the dataset. Otherwise, more careful examination of the observation is required and the decision to include or discard the outlier is made only after determination of the origin of the outlier.
Skewness
Skewness is a measure of the asymmetry of a distribution.
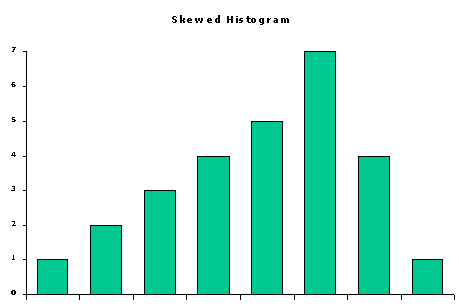
Certain statistical tests can only be applied to a normally distributed sample. A bell-shaped histogram may show that the dataset is normally distributed. But you must be careful. A dataset could be non-normal but appear bell shaped on a histogram.
Example: Heavy-tailed distributions are bell shaped, but can wreak havoc on statistical tests.
In the end, histograms should be used as a part of the process to determine if a dataset is normally distributed. Histograms alone CANNOT establish that a dataset is normally distributed.
Memory Jogger
Histograms are used to: