
Looking to Benchmark Pay?
CONDUCTING SALARY PLANNING
The following is an example of salary planning utilizing:
- Market pricing of jobs
- Market movement of salaries
- Competitive position to the marketplace through a compa-ratio report
- Cost of planned salary increase budgeting
Market Pricing of Jobs
It is important to determine the competitive position of the company in comparison to the defined marketplace. In order to accomplish this, reliable, up-to-date market data should be used to assess the labor market.
Once all market data is retrieved for all jobs being market priced, the salary ranges can be calculated using several methodologies:
- Regression Analysis - Straight line
- Regression Analysis - Curved line
- Market Pricing
The five jobs below capture the actual market rate per job for a San Francisco-based business and the applicable salary range minimum, midpoint, and maximum.
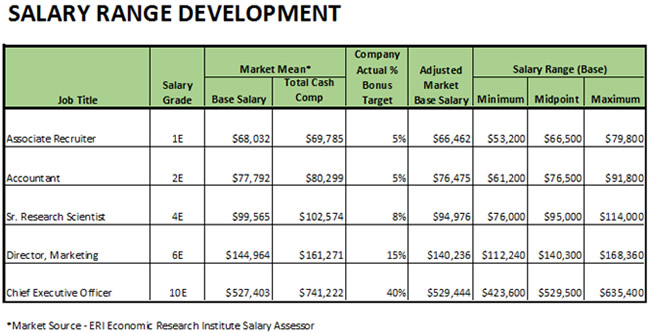
Once the market data has been summarized and the salary structure has been developed, it is time to compare the company's pay rates to the market rates.
Compa-Ratios
Compa-ratios are a common way to measure the competitiveness of an employee, team, department, or company relative to the marketplace.
| Compa-ratio | The compa-ratio indicates how the salary level of an employee or group of employees compares with the midpoint of the pay range OR with the average pay for a position in the general labor market. |
|---|
A compa-ratio of 1.00 indicates that the employee's pay is the same as the midpoint of the range.
|
Here is the formula for determining a compa-ratio: Compa-ratio = employee base salary / midpoint of the range |
If the compa-ratio is 1.06, the average of the pay paid in that salary range exceeds the midpoint by 6%.
The reason to focus on this statistic comes from the assumption that the midpoint of the pay range is where the "average" performer should be paid. Given a number of people in a salary range, the average should therefore be the midpoint of the range.
A compa-ratio of more than 1.00 can be the result of:
- a conscious decision by the organization to pay above average
- long tenure of people in the salary range
- superior performance of these people
- OR
- a number of other reasons
A high compa-ratio is a signal that things need to be looked at - not that things are wrong.
It is desirable that a company have a compa ratio between .95 - 1.05 (5% below the market up to 5% above the market). The external market fluctuates each year as well as the internal compensation of each business. Although each company will have a different compensation philosophy, it is a good idea to closely review reasons for compa ratios below .95 and above 1.05. In these cases, a company may wish to review the reasons for the compa ratio and take corrective steps, if needed.
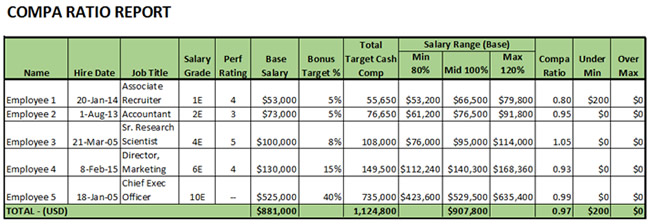
Below is an example of a typical compa-ratio report. You can see the employees' base salaries are compared to the midpoints of the applicable salary range. The compa-ratio column reflects each employee's competitiveness relative to the marketplace. The value of the report is the ability to capture each department's competitiveness compared to the marketplace and the overall company's competitiveness compared to the market.
This business has an overall compa ratio of .97 (which is 3% below the marketplace). Employee 1 is below the new salary range minimum at a annualized cost of $200.
Exercise Question
How might you explain a compa-ratio of 1.20 for a small team?