
Looking to Benchmark Pay?
Developing the Pay-Policy Line
To create a smooth progression, you will need to fit a pay-policy line to the plotted points reflecting the salary structure discussed in the prior section. The line may be straight or curved and may be calculated using a number of different methods. A curved line is typically more accurate than a straight line. A straight line is typically easier to calculate and administer.
Methods
When developing a single salary structure, a straight line can effectively be used. Depending on the resources available to conduct the analysis, the types of lines compensation practitioners may use include:
- low-high
- freehand
- least-squares
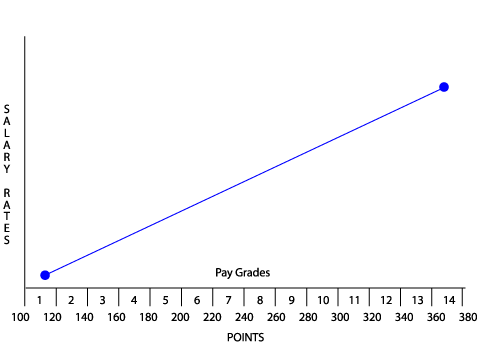
Low-high line. This is a straight line connecting the highest and the lowest of the plotted points (often called anchor points). The rates of all intervening jobs are made to fall on the line. Review the line carefully to ensure that the rates falling between the two anchor points are reflective of the reasonable market rates for each level. Otherwise, the high or low rate may produce a line inappropriate for the rest of the structure. Below is an example of a low-high line.
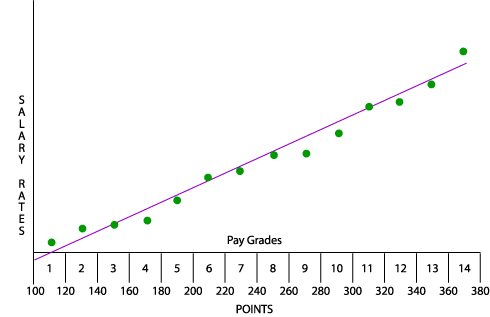
Freehand line. After you plot the points, you can often easily visualize the trend of the data. In this case, it is possible for you to draw a freehand line that best describes the plotted points. In drawing such a line, follow the principle that vertical deviations from the line are minimized if the line follows the obvious slope of the data. Although the line may be curved, a straight line has the advantages of being easy to plot and simple to explain. Below is an example of a freehand straight line.
Least-squares line. The least-squares line minimizes the overall vertical distance from the points to the line. Microsoft Excel and other software can automatically calculate these trend lines and the resulting formula for developing salary range midpoints of a salary structure.
Example: ($350 x Point) – 250 = Market Value at Point Value. In this example, the desired point value is multiplied by $350, and then the Y intercept (a negative value in the above example is subtracted from the result. The result produces a market-competitive value at each point value for the applicable job.
(See ERIDLC Course 49, Regression Analysis Used in Compensation Administration for instructions on computing a least-squares line.)
Which line should you use?
All approaches can produce an effective salary structure. The least-squares line and its formula is typically preferred by compensation professionals as it is statistically a better fit than the other two approaches. Not all pay policy lines represent a best fit of the data. It is important to review the dataset influencing the line to determine if any corrections to the dataset will improve the pay policy line. Ask yourself if this is an implementable approach.
Memory Jogger
The highest degree of accuracy in a pay-policy line will be attained by using a: