
Looking to Benchmark Pay?
Benchmarking and Peer Groups
Consider the following:
- Median total direct compensation (TDC) for CEOs at publicly traded companies increased more than 71.7% in the post-recession eight-year period 2009 to 2017. More recently, in 2021, CEO TDC was up 9.8%. 2022 saw a small decline in CEO TDC, but in 2023 it began to rise again, all-be-it at a low single digit pace. In 2024, CEO total direct compensation increased 7.8%.
- Most public company CEOs are granted some form of equity award. Growth in equity awards is the primary driver of recent increases in executive compensation.
Competitive compensation benchmarking is one of the areas that is highly transparent and if not properly explained in the appropriate business context can have a negative impact on stakeholder acceptance. An optimal executive compensation plan needs to be competitive for executives and uses shareholder value maximization as the performance standard. This is not the same thing as maximizing the stock price, particularly in the short run.
Some criteria that need to be used in evaluating salary survey data to set executive compensation are:
- Timely - the data used needs to be recent with some "aging" to bring it up to the date when the decision is being made.
- Reliable - the data should be from a trusted source with a sufficient sample size.
- Comparable - the executive's job description needs to match the job descriptions of incumbent executives. In order of relative importance, the best surveys are ones with incumbents in organizations similar to your situation in terms of company size, industry, and location.
- Informative - more information is better. The best surveys provide multiple measures of central tendency, as well as information about the spread of the incumbent data (e.g. percentiles, standard errors, etc.).
Companies select peer groups based on current competitors for business, capital and talent, as well as size and complexity. Revenue is generally the most appropriate measure of size and complexity and is reflected in considerations such as customer base, global footprint, technological requirements and government regulation.
There should be a consensus on the key selection criteria and parameters followed by a robust evaluation of current and alternate peer groups. To provide greater transparency behind the numbers presented, as many as 15 to 30 companies may be used.
Budgets permitting, consider additional survey sources to complete the picture.
- When assessing market positioning, peer group data should be supplemented with market pay data reflecting the characteristics of your organization.
- Industry-specific salary surveys are useful in measuring how expertise in a specific industry might drive pay differences.
- Industry-agnostic surveys (based on company size or location) offer a broader perspective and reflect the reality that the labor force combines all types of expertise.
Analytics Example
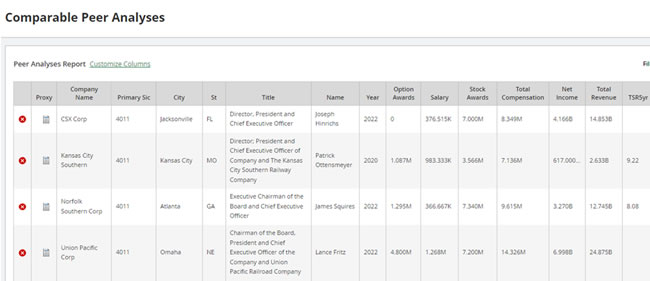
In the example below, railroad companies with a Revenue Size of $2 billion to $25 billion have been selected within the transportation and distribution industry, NAICS code 482000. (Data is provided solely to show how executive pay may be compared and analyzed using different metrics and distributed among the different pay elements.)
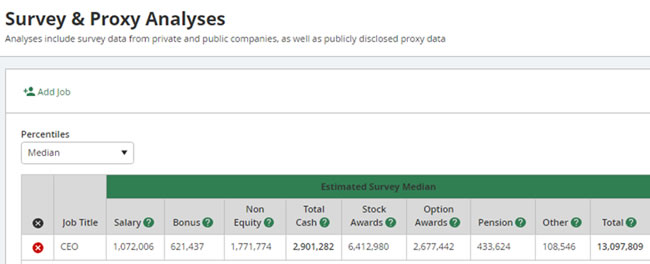
Based on the compensation analytics, a reasonable estimate of median total compensation and its various components for a CEO at a railroad company with $12 billion in revenue is shown below:
Memory Jogger
Criteria for evaluating the quality of salary survey data include all of the following except: