We took projected compensation metrics from ERI’s Salary Assessor and compared them to recently gathered salary survey data to see how accurate the data inside our Assessors was. The results ended up showing that ERI’s Salary Assessor mean was an accurate predictor of salary survey results when comparing the two in a t-test sample and a regression test.
When evaluating research, a natural question is whether the results of the research match reality. Can the numbers be trusted? Will they improve the decisions that a compensation manager makes? To answer these questions, a user might examine a survey’s sample size or methodology; however, these techniques put the burden of evaluation on the individual user. Another approach is for the research firm to compare the results of one study to the results of a second independent study. A high level of agreement between the two studies lends credence to the accuracy of both studies.
Simply stated, if we ask a question twice and we get the same results each time, we can have a higher level of confidence in the accuracy of the research methods. This is called a convergent validity study in the research community.
There are several ways to compare research methods, the most appropriate of which depends on the type of research being evaluated. Regarding compensation research, one way to examine the quality of research is to compare published results of data that were collected at the time of publication. We compared time-matched independent datasets from ERI’s Salary Assessor and ERI’s Salary Surveys.
Background and Methodology
ERI publishes traditional compensation and benefits survey reports for the United States and Canada. Data for these surveys are collected and published once each year, delivering benchmark results with descriptive statistics. ERI’s Salary Assessor, part of ERI’s Assessor Platform, is a time series analysis of salary survey data. The survey data from ERI’s 2019 Salary Surveys were compared to the results published in the Salary Assessor on January 1, 2019. A few points regarding the construct of this study are provided below:
- These are two fully independent, mutually exclusive data sources with different methodologies. The January 1, 2019, Salary Assessor data release did not contain any of the data collected for the 2019 Salary Surveys.
- The Salary Assessor research published for the first quarter of 2019 was compared to the survey data collected in the first quarter of 2019. The data submission deadline for the Salary Surveys was March 31, 2019, and most data were submitted in the early months of 2019.
- The 2019 Salary Survey results were later included in the Salary Assessor but not as of the first quarter of 2019, as is required under safe harbor guidelines. ERI’s Salary Survey data, representing 1,759 occupations and 135,626 incumbents, were matched by job number to January 1, 2019, research published in the Salary Assessor.
- The mean salary published in the Salary Assessor was $79,841 and the mean salary collected by the Salary Surveys was $79,154. This represents a difference of $687 and a 99.1% agreement between the two sources.

Results
To examine the extent of agreement between the two sources, a series of analyses was conducted. The first one, called a t-test, helps examine the differences between both sources at a macro level. It answers the question of whether the overall average (mean) of the Salary Surveys is different from the overall average of the Salary Assessor. The second test, called regression, helps examine whether one variable can predict another. The current study examines whether the Salary Assessor can predict responses to the Salary Surveys.
First, a paired sample t-test was conducted. This test compared the means from the two samples to determine if, from an overall perspective, one sample was fundamentally different from the other. This test found that there was not a statistically significant difference between the two data sources, t(1759)=1.59, p=.11. This means that the Salary Assessor mean of $79,841 was close enough to the mean of the surveys ($79,154) that the difference between the two was likely due to chance.
The Salary Assessor projects current salary averages by analyzing salary data over time to see trends. We then compare those projections to actual salary surveys conducted during the specified time to determine how accurate the data is. We found the average salary reported by both sources to be very similar, with a 99.1% agreement.
Next, a regression analysis was conducted between the Salary Assessor and the Salary Surveys. The Salary Assessor uses a time series analysis to predict salaries on the first day of each quarter. This regression was conducted to determine whether the Salary Assessor was successful in this prediction. Specifically, the independent variable (Salary Assessor mean values) was compared to the dependent variable (Salary Survey mean values). The results indicated that the Salary Assessor was a significant predictor of the Salary Survey results: F(1,1758)=8173.42, p<.0001, R2=.82. This means the Salary Assessor could predict the salaries reported in the Salary Surveys, ensuring the reliability of our salary analysis tool.
The results of these tests are summarized in Table 1 and Figure 1 below:
TABLE 1. MEAN AND STANDARD DEVIATION FOR SALARY ASSESSOR AND SALARY SURVEYS
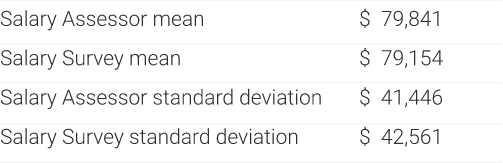
FIGURE 1. DISTRIBUTION AND MEAN OF SALARY SOURCES
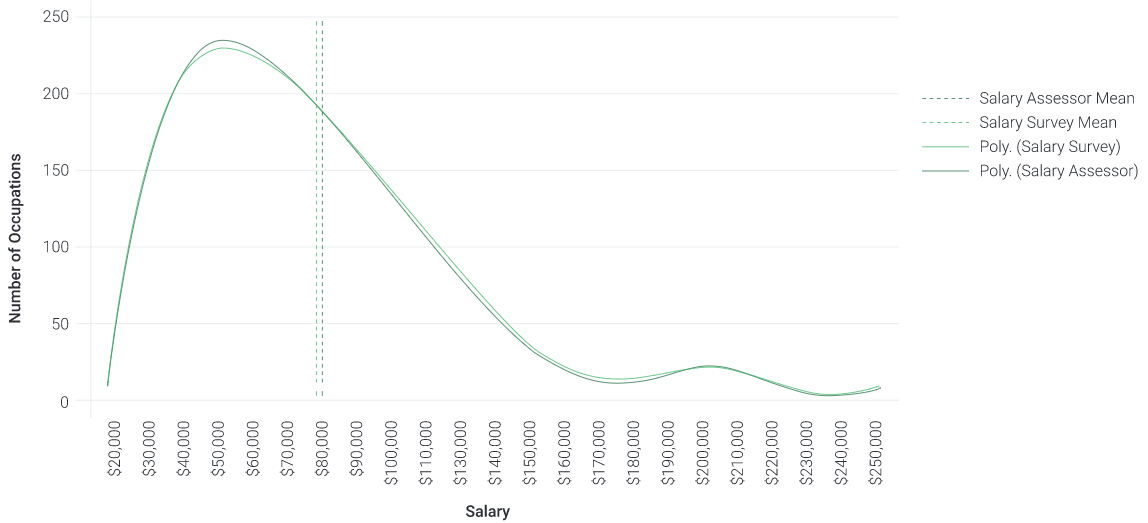
In the above chart, the curved lines show the number of occupations at each salary point. As is common in compensation, there are fewer occupations at higher salary levels than lower salary levels (called positive skew). The amount of overlap between the line representing Salary Surveys and the line representing the Salary Assessor indicates that the data from the two sources are distributed throughout the salary range in a similar manner. The vertical green and red lines represent the mean of each data source. They are placed on the chart to provide a reference between Figure 1 and data presented in Table 1.
The results from the t-test show that the difference found between the Salary Assessor mean of $79,841 was close enough to the mean of the Salary Surveys ($79,154) that the difference between the two numbers was due to chance. The regression analysis also reported the Salary Assessor data accurately predicted the data in the gathered Salary Surveys.
Conclusion
The two analyses listed above show a high level of agreement between these two independent studies. First, the results of the t-test indicate that the two samples are not different in terms of the mean. If there were a fundamental bias to one of these methodologies, it might be expected to be revealed through this test. The fact that they were not significantly different in this test lends credence to the idea that both methodologies are testing the same underlying reality. Second, the results of the regression indicated that the Salary Assessor was a significant predictor of the time-matched survey results. The statistical analyses indicate that the agreement between the two studies was not due to chance. Taken together, these analyses support the accuracy of the Salary Assessor and Salary Survey methodology.
Take Away
ERI’s Salary Assessor data are an accurate predictor of the data that salary surveys would present if collected at that time.
If you are interested in seeing a sample of our accurate salary data for yourself, contact our sales team or try a self-paced demo.