Each quarter, ERI examines the rates at which compensation has increased and provides guidance on expected increases for the upcoming year. These rates are calculated using ERI’s Salary Assessor and ERI’s Salary Increase Survey & Forecast. In the context of this paper, results represent actual growth reported in ERI’s Salary Assessor over periods ranging from one quarter to twenty years.
Actual compensation movement in the first quarter of 2023 (published April 1, 2023) saw a lower level of growth at 1.1%, below January’s 1.39% growth. The past four quarters have seen higher-than-average growth, with 4.51% growth since the July 2022 data release. ERI’s Salary Increase Survey was also updated in January with new data, which saw increases in both the structure (2.91%) and budget (3.79%) growth rates. These updated results support the idea that the economy is trending towards higher compensation. This rate of growth is also above the 20-year quarterly and annual growth rates, which are 0.63% and 2.53% respectively.
Current labor market data indicate a softer market than spring/summer 2022, but one that is still competitive. This labor market may require organizations to increase compensation to attract employees. However, as labor markets continue to loosen, the pressure on wage growth will decrease. Specifically, the unemployment rate was 3.6%, which is up from July’s low of 3.5%, but still generally considered full employment. The prime-age population ratio (EPOP) has softened to 80.5%, which is 0.3% above the recent peak of 80.2% in September. The 30-year average EPOP is 78.6%, which is below the current participation rate and equal to the rate immediately prior to the start of the recent pandemic (80.5%). An examination of the current number of job openings indicates a high number of open jobs in the United States, with an open job rate of 6.5%, which is higher than the 10-year average open job rate of 4.5%. However, it is down from the high of 7.3% in March. Additionally, the Quits rate is currently 2.5%, which is also down from its high of 2.9% in April. Despite this softening, the overall labor market is still tight, which points towards higher compensation growth. Further softening may reduce this pressure, but that level does not appear to have been reached yet.
Of course, the labor market is not the full story. At the time of writing, the inflation rate also stands at 6%, which is down 3.1% since the high in June. These trends appear to indicate reduction from peak inflation, which may have a tempering effect on compensation increases. Inflation can influence the growth of compensation, and the extent of that influence also varies depending on the level of inflation, with high inflation being related to higher levels of compensation growth. Inflation is still high by historical standards, so we may continue to see higher levels of compensation growth, but the reduction in inflation may mean that the high rate of compensation increase will also slow in 2023.
Compensation growth could decrease at a more rapid rate due to an external factor, such as a recession. Recessions are generally coupled with higher rates of unemployment, which reduces competition for labor among organizations. Current recession metrics do not indicate a recession at this time. Specifically, gross domestic product (GDP) was 1.2% in the fourth quarter of 2022, and 1.9% and 1.8% in the previous two quarters respectively, which are all growth states. However, some leading metrics have retreated from previous highs, which may indicate a weakening of the economy. Specifically, real income is decreasing, moving from 1.2% in January to 1.4% in March. Industrial production decreased from 2.5% in November to 0.8% in January, and wholesale sales decreased to 3.61% in January from 8.67% in November.
In summary, there are competing forces between the strong labor market, high inflation, and increasing interest rates. A strong labor market and inflation both point toward high compensation growth, but recent retreats in leading economic indicators indicate some headwinds. ERI expects higher compensation growth going into 2023, with the absolute rate of growth slowing throughout the year. ERI will continue monitoring and reporting on these trends as they unfold over the next several quarters.
Overall Compensation Trends
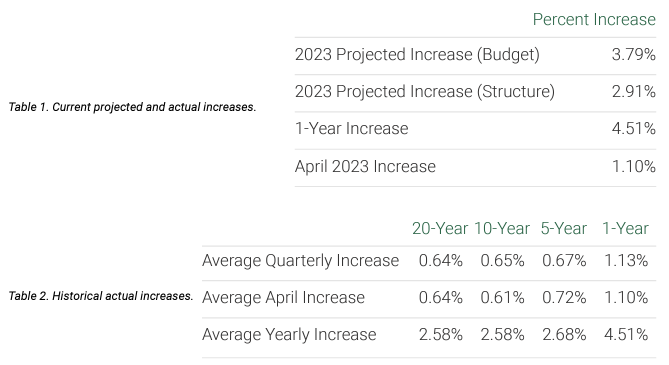
April salaries have increased by 1.10% (see Table 1) over the January 1 data release. This rate of growth is higher than the predicted quarterly rate of 0.73%. Growth over the past year has been 4.51%, with an average quarterly growth of 1.13%. To put this into context, the average quarterly growth over the past 20 years has been 0.64% (see Table 2). Over the same 20-year period, the average April increase has been 0.64%. Over the past 20 years, April increases (first quarter) have been consistent with increases throughout the rest of the year, and the current quarter is consistent with that trend. The annual growth rate appears to have increased from 4.14% to 4.51%, which is due to high growth in the most recent two quarters. Previous quarters’ growth rates were 1.39% (January 2023), 1.29% (October 2022), and 0.73% (July 2022).
Overall Trends by Year
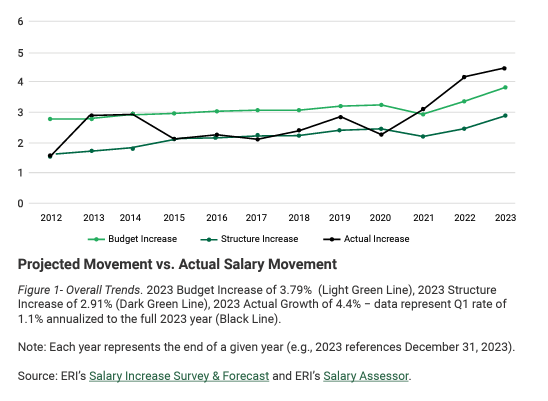
Please refer to Figure 1 below, which has three lines. Two lines (dark green and light green) represent projected salary increases from ERI’s Salary Increase Survey & Forecast, and the black line represents actual changes in salary reported in ERI’s Salary Assessor. The dark green and light green lines represent what survey respondents expected to happen each year (collected in the previous year), and the black line represents what happened in a given year. By comparing these three lines, we can see the extent to which expectations met up with reality. As noted earlier, the actual movement (black line) is expected to follow the structure increase (dark green line). This is because salary surveys generally capture the movement of salary structures within organizations instead of measuring the salary increase of individual employees.
An examination of where the reality of salary movement (black line) has departed from the expected trend line (dark green line) gives us information regarding how salaries might move in the future. Specifically, the past 2013 and 2014 saw actual salaries grow at a rate that is higher than expectations from the previous year. The years 2015 through 2020 were more in line with expected growth (dark green), and growth since 2020 has been higher than predicted.
10-Year Trend by Category
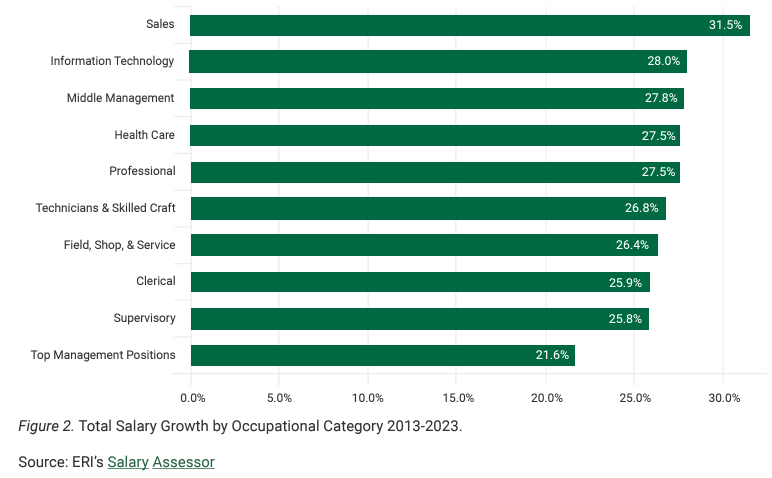
While it is valuable to know how all occupations are moving in this economy, it is also useful to know how different types of occupations move relative to each other and across time. Not all occupations grow at the same rate, and not all occupations grow at the same rate across time. Figure 2 reveals the total growth experienced across a 10-year period. If we break all occupations down into 10 categories, it becomes clear that some occupations are growing at a faster rate than others. Specifically, Sales employees appear to have seen the highest level of growth, whereas Top Management occupations have seen the slowest growth.
Mean Salary by Category
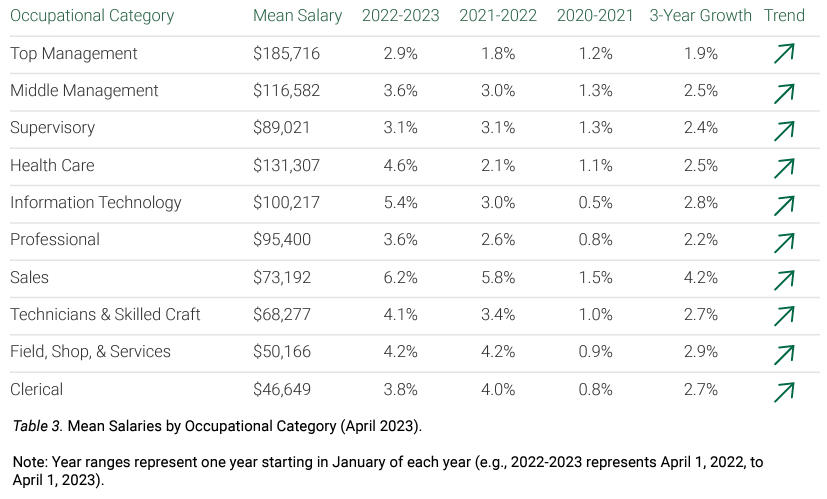
Table 3 reveals the actual growth rates for different occupational categories in the past three years and provides information on whether the occupational category is seeing increased or decreased growth. It is important to note that, just because an occupational category has decelerating growth, it does not mean that the trend will continue. All occupations may be expected to see salary growth over time, so an occupational category that has been showing slow growth may be more likely to see higher growth in the future.
Occupational Categories
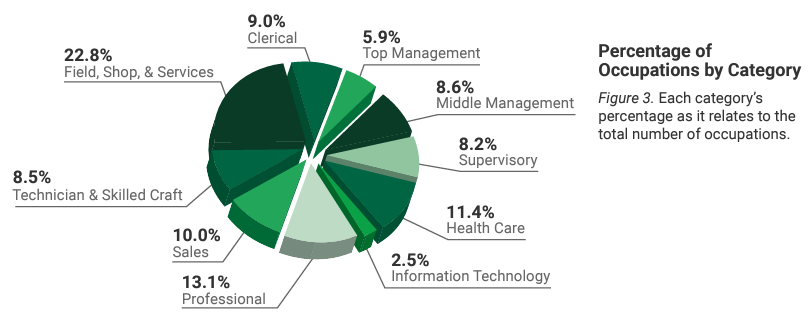
In the process of examining the growth of compensation data on a national basis, the data were broken into ten specific occupational categories to study changes in compensation at a more granular level. The populations of these categories are illustrated in Figure 3 below.
About the National Compensation Forecast
The National Compensation Forecast is designed to capture salary changes across a broad range of jobs found in the United States economy. This index shows how national compensation has changed over the 20 years prior to the time of publication: April 2024. Of note, these figures represent actual and projected salary growth for base compensation only. Other sources include data on the cost of benefits, incentives, and base compensation. By simplifying the analysis and focusing only on the fundamental component of compensation (base compensation), ERI hopes to provide a cleaner picture of how compensation is growing in the United States. The data contained in this report are derived from quarterly results published in ERI’s Salary Assessor, a professional compensation tool used widely across the public and private sector, including most Fortune 500 organizations. For a full discussion of the product’s methodology, please see the Salary Assessor methodology. The specific data used in this report represent 2,052 distinct occupations, which were consistently surveyed across the 20 years covered by this report. These occupations range from the lowest-paid occupation that ERI surveys (Dishwasher) to the highest-paid occupation (CEO) and represent mean base salary. Data are first examined on an aggregate basis before being broken down into 10 occupational categories. The data for the 2024 index comes from data submitted to ERI’s Salary Increase Survey & Forecast.
In coming quarters, ERI will continue to track and report on the trends that exist in the compensation landscape.
Please direct any questions or comments to Jonas Johnson, Ph.D.: [email protected].
By Jonas P. Johnson, Ph.D. and Calvin A. Brooks