Chapter 5: Quantitative Methods Used In Human Resources
PREDICTIVE STATISTICS: Part 3
Stepwise Regression
Stepwise regression is still another form of linear multiple regression. It produces the predictive equations in a series of steps. It selects the first variable from a sample of variables that does the best job of estimating the variable to be predicted. Usually the decision criterion (although commercially available programs occasionally differ) is the correlation. The analysis is then completed in a series of steps.
For a variable to be predicted, such as management compensation (C), for example, three predictive variables may be selected:
- assets
- revenue
- people
In reviewing correlations between these variables and compensation, one might find the following:
| Predictive Variable | Correlation Coefficient |
|---|---|
| Assets (A) | 0.69 |
| Revenue (R) | 0.83 |
| People (P) | 0.49 |
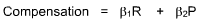
Step 1. Show a linear equation of the variable with the highest correlation:
y = mx + b
Compensation = (m) (Revenue) + b
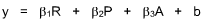
Step 2. Select the variable that in combination with the variable in Step 1 does the best job of predicting y (compensation). Combined, these two variables yield the revised correlation -- multiple correlation. It is necessary to realize that this combination of variables is not necessarily the two variables with the two highest correlations. Among the variables, each is reviewed as to how it relates to the others, as well as to the variable to be predicted. For instance, consider the following matrix:
| Compensation | Assets | Revenue | People | |
|---|---|---|---|---|
| Compensation | 1.00 | |||
| Assets | 0.69 | 1.00 | ||
| Revenue | 0.83 | 0.89 | 1.00 | |
| People | 0.49 | 0.16 | 0.09 | 1.00 |
The correlation matrix above shows that Assets and Revenue are highly correlated. That means Revenue has already explained most of what Assets could predict. Therefore, Step 2 would read:
Step 3:
Stepwise regression example
An analyst is presented with the correlation matrix shown below. How might the first three steps read in a stepwise regression analysis?
| CORRELATION MATRIX | |||||||
|---|---|---|---|---|---|---|---|
| R | S | T | U | V | W | X | |
| R | 1.00 | ||||||
| S | 0.15 | 1.00 | |||||
| T | 0.93 | 0.41 | 1.00 | ||||
| U | 0.76 | 0.37 | 0.74 | 1.00 | |||
| V | 0.62 | 0.56 | 0.05 | 0.14 | 1.00 | ||
| W | 0.24 | 0.48 | 0.48 | 0.57 | 0.81 | 1.00 | |
| X | 0.31 | 0.39 | 0.14 | 0.61 | 0.64 | 0.11 | 1.00 |
Stepwise regression solution
Step 1. Select the variable with the highest correlation with the dependent variable R.
Step 2. Examine T for a low intercorrelation with a variable that has a high correlation with R.
Step 3. Repeat the process in step 2. Do not be surprised if computer analyses begin to vary from your judgments.
Non-Linear Regression
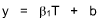
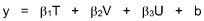
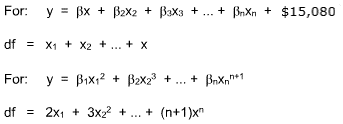
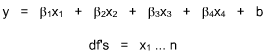
Non-linear regression allows an analyst to find the "best-fit" to multiple factor data through the use of curved (exponential or functions that one can define) equations. Like multiple or stepwise regression, non-linear regression combines pre-selected predictive variables in an equation that estimates the variable to be predicted more accurately. Unlike multiple regression forms, the sub-functions for each variable are not linear. Non-linear regression allows the analyst to pre-select the predicting equation. For example, the standard equation would be:

where y is the variable to be predicted, the x's are known variables, b is the intercept and the b's are the coefficients.
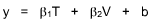
For example:

In this case, the intercept has been changed to the minimum wage ($7.25 per hour x 2,080 hours per year = $15,080.) Or, the analyst could select an equation with the intercept set at 0, and each predicting variable is taken to an ever increasing power, such as:

Special note: Non-linear regression also requires the definition of the differential.
Non-linear regression may use a variety of estimating techniques
- differentials
- correlations of residuals (sometimes called serial correlation)
- simple reducing of residuals through increments of residual differences
Of special interest to human resources practitioners is the ability to pre-select maximum and minimum weights for coefficients.
Non-linear regression example
A human resources manager wishes to design his own job evaluation plan. Using four factors:
- skill
- effort
- responsibility
- working conditions
He constructs differentiation of 1 - 5 levels for each factor. In assigning points to these values (against a variable to be predicted that was based on market rates and adjusted for bias), he wanted the values to be equal at the minimum wage and to predict the minimum wage if all factors were 0 (although the scale was from 1 through 5.)
Non-linear regression solution
Non-linear regression is the applicable technique because of the desire to state minimums and maximums to define a specific beginning intercept. Assume the initial data looks like this.
| Position | Skill (S) | Effort (E) | Responsiblity (R) | Working Conditions (W) | Points | No-bias Salary ($)* |
|---|---|---|---|---|---|---|
| Lowest | 1 | 1 | 1 | 1 | 1,000 | 22,000 |
| Highest | 5 | 5 | 5 | 5 | 7,000 | 70,000 |
Assign minimum value of the minimum wage of $15,080 and utilize the equation:
Hence:

of the lowest position:
$22,000 - $15,080 = $6,920
left to be predicted, so among the four factors, the minimum is:
$6,920 / 4 = $1,730
At the top position:
$70,000 - $15,080 = $54,920
points remaining. If no factor could account for more than 1/2 the variance:
$54,920 / 2 = $27,460
$27,460 / 5 = $5,492
for the maximum.
Part Correlation
In 1979 the National Academy of Sciences produced a preliminary set of proposed guidelines for eliminating discriminatory bias in job evaluation plans. In these proposed guidelines, it introduced the concept of "part correlation" which was expressed in two equations.
Equation 1:
y = m(F) + b
This takes the form of a normal regression equation where F is the percentage of female among incumbents and m is the coefficient associated with the percentage of females. This coefficient is the average or expected change in salaries associated with a 1% change in gender composition of the occupation.
To understand the application, let us picture a job evaluation plan with one factor, skill. Skill predicts the value of each position so that:
value = coefficient x skill + intercept
If the market value were $7,000 per month and the intercept were $0, then:
$7,000 = 100 x 70 skill points + $0
If the marketplace was found to discriminate (past and present) by filling this position mostly with women, the rates recorded could be expressed as:
y = $100 + 0.12x
It would show that women are 12% behind men in positions requiring similar skill + $100 whole dollars. (That is, if $100 = 0, we would say the difference is 12%.) Applying the part coefficient, the correct equation would be determined as:
Value = 112 x points + $100
That is, for jobs held primarily by women:
y = m(F) + b
The explanation of part correlation discussed in the National Academy of Sciences staff report to the EEOC and in proposed guidelines for job evaluation plans were as follows:
Acceptable procedures for determining factor weights are those that partial out (in the statistical sense) the effect of sex (or race) composition of jobs on the factor weights. Here, for those who want to tie factor weights to market salary rates, we suggest one possible statistical approach, but do not intend to suggest that it is the only acceptable approach. The acceptability of statistical procedures will depend primarily upon their effectiveness in eliminating any influence of the sex or race composition of jobs on the factor weights.
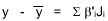
In the ordinary multiple regression approach to the derivation of factor weights and equation of the form:

is estimated where:
- y is the average wage or salary for a job
- Ji is the measured job evaluation factors
- βi is net partial regression coefficients expressed in standard form yielded by the estimating procedure
The bi is the weight accorded each variable; it is used to adjust the scale values for each factor. The part-correlation approach requires two steps. First, an equation of the form:

is estimated where:
- y again equals the average salary for a job
- F is the percent female among incumbents
- m is the coefficient associated with percent female (that is, the average or expected change in salary associated with a one percent change in the sex composition of the occupation)
- y = the average salary for a job predicted by the equation
Second, an equation of the form:
is estimated, where the independent variables are the job evaluation factors, just as in the ordinary multiple regression approach but the dependent variable is the difference between the actual average salary and the average salary predicted on the basis of this percent female among occupational incumbents. The coefficient b¢i derived from this equation tells us how much each factor contributes to salary differences above and beyond what can be accounted for by the sex composition of jobs. The difference between the part-correlation approach and conventional multiple regression approaches of the kind that are ordinarily used to derive factor weights is that in conventional multiple regression, the joint variance associated with each of the job evaluation factors and percent female -- which exists because job evaluation factors tend to be correlated with percent female for the reasons indicated above -- is divided between the variables. In the part-correlation approach, it is attributed entirely to the percent female and only the variance uniquely associated with the job evaluation factors affects their weight. It is this restriction that produces a set of weights free of gender bias.3
Page 7 of 7
Footnotes
3 Proposed Guidelines for the Use of Job Evaluation Procedures in a Non-Discriminatory Manner (National Academy of Sciences: 1979), pp. 11-13.
Internet Based Benefits & Compensation Administration
Thomas J. Atchison
David W. Belcher
David J. Thomsen
ERI Economic Research Institute
Copyright © 2000 -
Library of Congress Cataloging-in-Publication Data
HF5549.5.C67B45 1987 658.3'2 86-25494 ISBN 0-13-154790-9
Previously published under the title of Wage and Salary Administration.
The framework for this text was originally copyrighted in 1987, 1974, 1962, and 1955 by Prentice-Hall, Inc. All rights were acquired by ERI in 2000 via reverted rights from the Belcher Scholarship Foundation and Thomas Atchison.
All rights reserved. No part of this text may be reproduced for sale, in any form or by any means, without permission in writing from ERI Economic Research Institute. Students may download and print chapters, graphs, and case studies from this text via an Internet browser for their personal use.
Printed in the United States of America
10 9 8 7 6 5 4 3 2 1
ISBN 0-13-154790-9 01


The ERI Distance Learning Center is registered with the National Association of State Boards of Accountancy (NASBA) as a sponsor of continuing professional education on the National Registry of CPE Sponsors. State boards of accountancy have final authority on the acceptance of individual courses for CPE credit. Complaints regarding registered sponsors may be submitted to the National Registry of CPE Sponsors through its website: www.learningmarket.org.