ERI Economic Research Institute is pleased to provide an expanded and updated glossary of commonly used compensation terms and formulas for your ongoing reference, effective January 1, 2023. The following is a sample of terms and formulas related to the topic of Salary Range, with an index of the complete reference provided below. Visit ERI to learn more about common compensation terms and stay updated on new and emerging HR terms and definitions.

Salary Range
A salary range represents the minimum, midpoint, and maximum rates that a business is willing to pay employees performing a job. Typically, the midpoint or control point is set to provide market competitive, fair, and equitable salaries based on the competitive marketplace for a business. Salary ranges can be determined using compensation software such as ERI’s Salary Assessor.
Salary Range (Employee Placement)

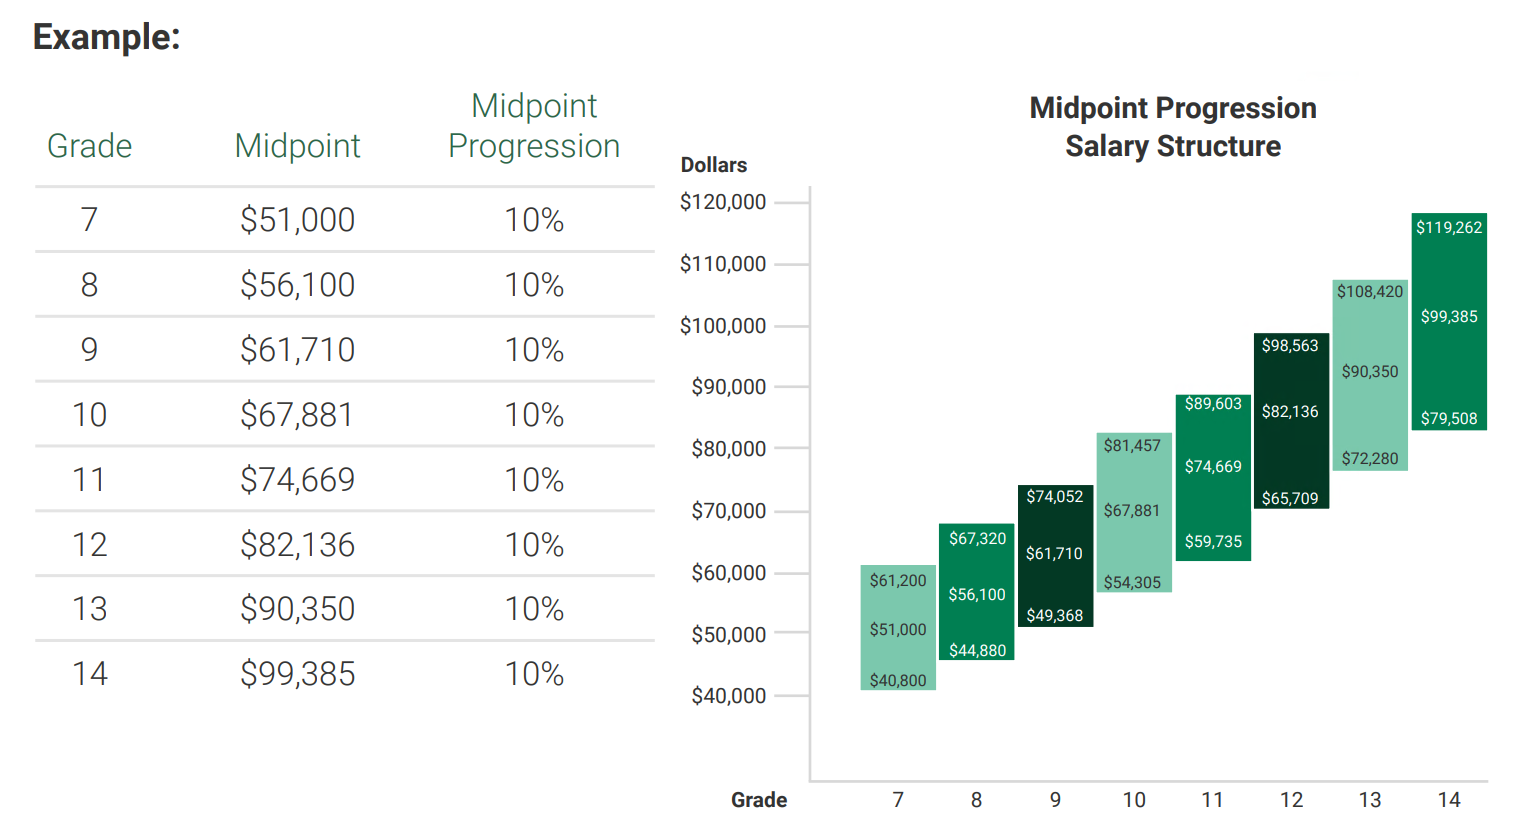
Salary Range Midpoint Progression
It is common to see salary range midpoint progressions (the percent difference between midpoints) within a salary structure as follows:
Administrative/Operative: 5-10%
Professional/Management: 10-15%
Executive: 15-20%
Salary Range Spread
It is common to see salary range spreads (the percent difference between the minimum and maximum) within a salary structure as follows:
Administrative/Operative: 40% +
Professional/Management: 50%+
Executives: 50-65% +
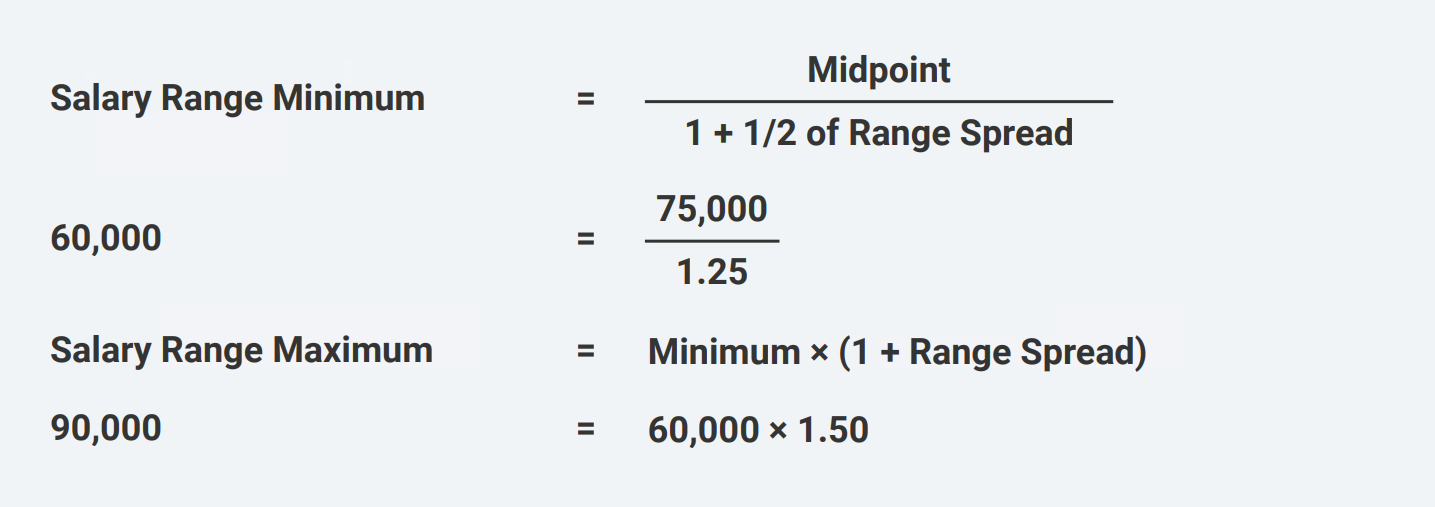
Salary Range Minimum and Maximum Formula
To calculate the salary range minimum and maximum from the salary range spread and midpoint (assumes a 75,000 midpoint and a 50% range spread):
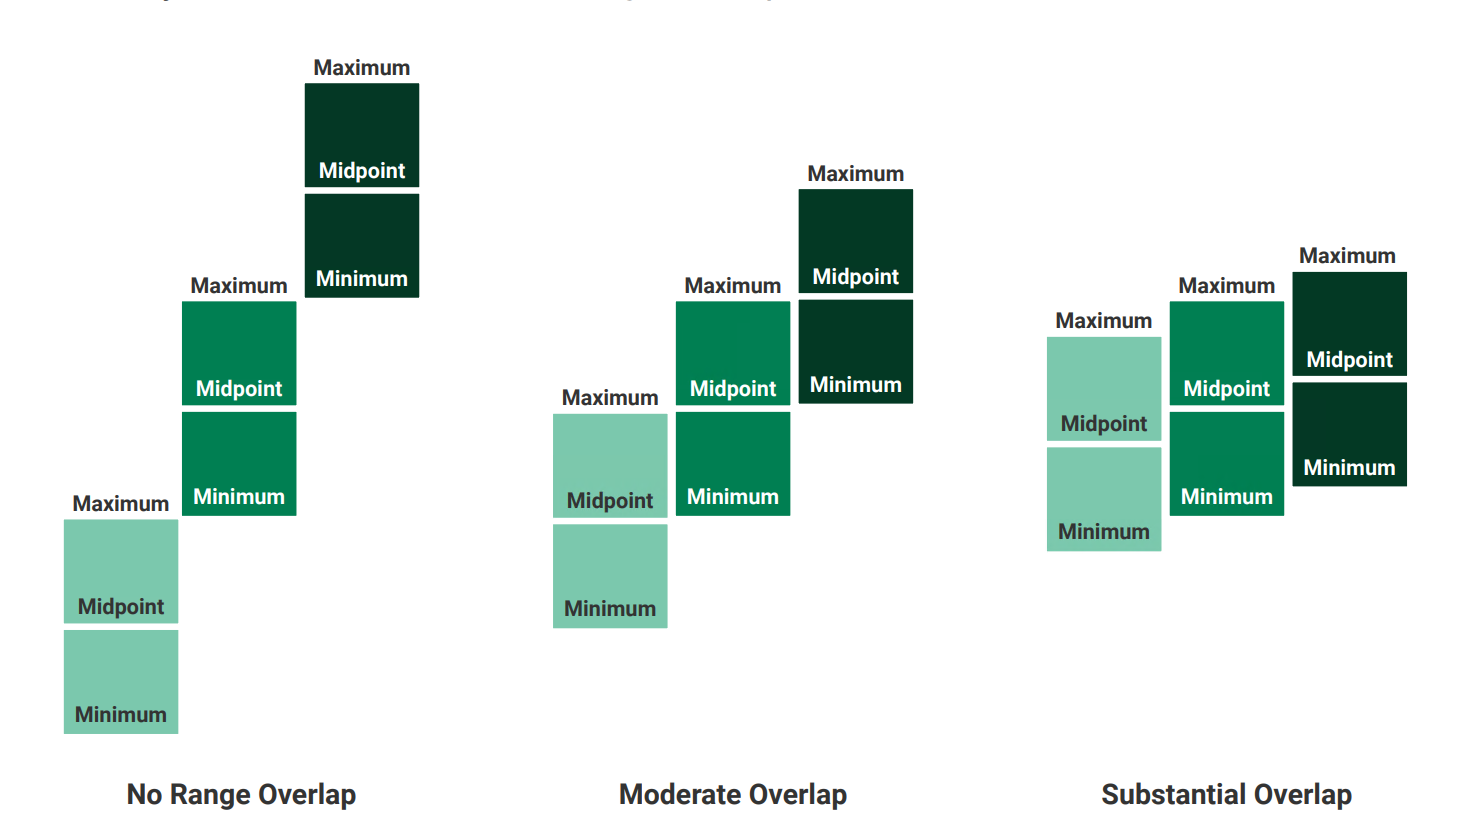
Salary Range Overlap
To calculate the salary range overlap:

Here are three examples of salary range overlap:
In the first example, a 0% overlap will not work unless it is a step structure.
In the second example, a 50-60% overlap is moderate. This should be the goal of a typical salary structure.
The last example shows substantial overlap. This would occur if there are too many salary grades or too little difference in market rates between salary grades. Pay equity issues may occur when a substantial range overlap occurs.
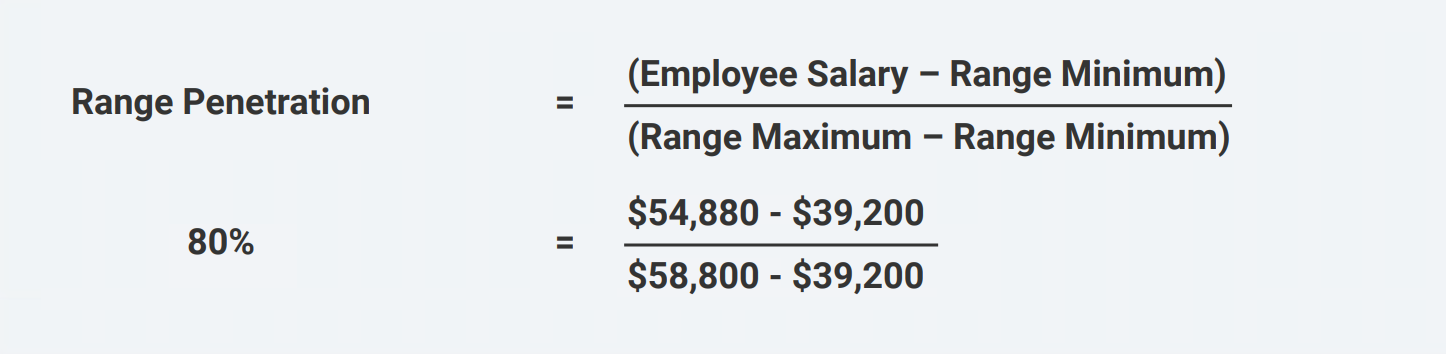
Salary Range Penetration
Salary Range Spread
To calculate the salary range spread from the maximum and minimum of a salary range:

To calculate the salary range spread from a minimum percent and maximum percent:

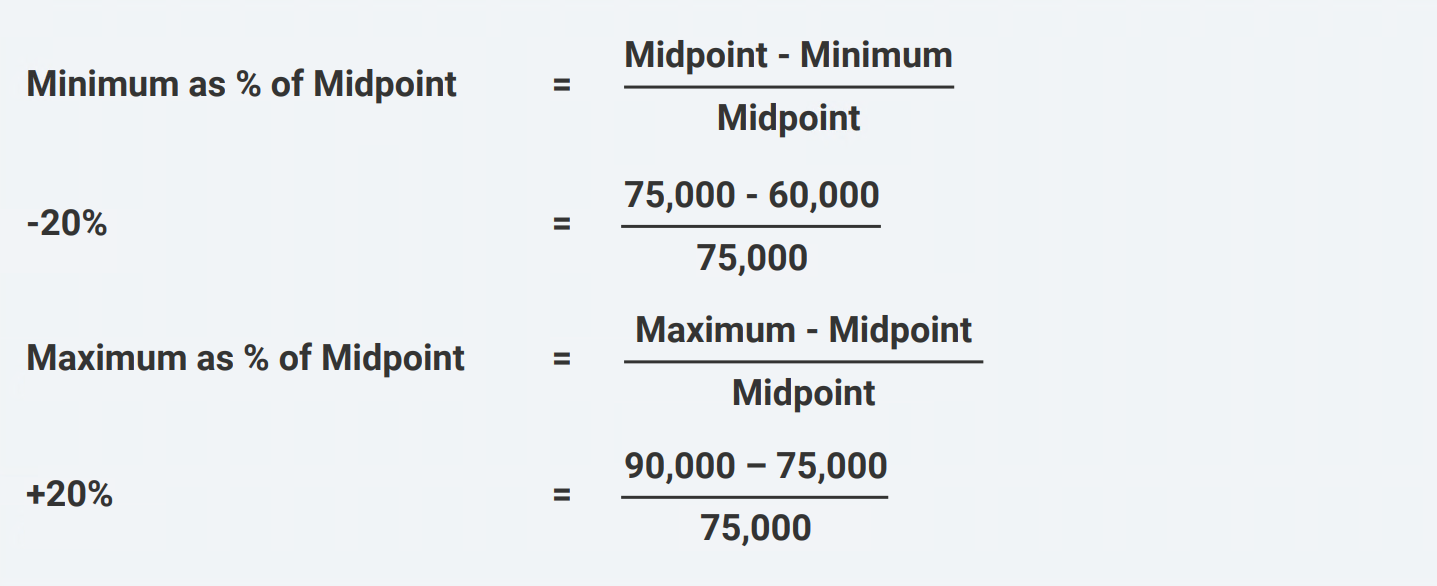
Salary Range Spread on Either Side of Midpoint
To calculate the salary range spread from the minimum to midpoint and the midpoint to maximum:
The updated and expanded Common Compensation Terms & Formulas whitepaper includes definitions and formulas for the following terms:
- Aging Salary Survey Data
- Annual Incentive Plan
- Benchmark Jobs
- Black Scholes
- Bonus
- Broadbands
- Budgeting – Promotional Increases
- Career Levels
- Coefficient of Determination
- Compa-Ratio
- Compensable Factors
- Compensation Benchmarking
- Compensation Mix
- Cost of Labor
- Cost of Living
- Cost-of-Living Increase
- Consumer Price Index (CPI)
- Curvilinear Regression
- Defined Benefit Plan – IRS Limit
- Defined Contribution Plan – IRS Limits
- Demotion
- European Works Council
- Excel Pivot Chart – Displaying an Equation
- Excel Rate Formula
- FICA Taxation
- Foreign Income Exclusion – IRS
- Gender Pay Gap
- Adjusted Gender Pay Gap
- Unadjusted Gender Pay Gap
- General Increases
- Grandfathering
- Gross Up
- Hours of Work
- Individual Retirement Account (IRA) – IRS Limits
- Internal Equity
- International Local Market Practice
- Job Architecture
- Job Code / Job Profile
- Job Evaluation – Market Pricing
- Job Family
- Job Leveling
- Lag the Market
- Lateral Transfer
- Lead Differential
- Lead-Lag the Market
- Lead the Market
- Linear Regression Analysis
- Long-Term Incentive Plan
- Lump-Sum Merit
- Market-Based Salary Structures
- Market Pricing
- Market Index
- Market Ratio
- Maximum
- Mean
- Median
- Merit Carve Out
- Merit Increase
- Mileage (IRS Standard Mileage Rate)
- Minimum Wage
- Mode
- On-Target Earnings
- Pay Equity
- Pay Grade / Salary Grade
- Pay Transparency
- Percentile
- Position in Range
- Promotion
- Promotional Budgets
- Prorating Merit Increases
- Pure Market Pricing
- Quartiles
- R Squared
- Range
- Range Penetration
- Range Spread
- Red-Circled and Green-Circled Employees
- Restricted Stock
- Salary Range
- Salary Range – Employee Placement
- Salary Range Maximum
- Salary Range Midpoint Progression
- Salary Range Minimum
- Salary Range Minimum and Maximum Formula
- Salary Range Overlap
- Salary Range Penetration
- Salary Range Spread
- Salary Range Spread on Either Side of Midpoint
- Salary Structure Adjustment
- Salary Structure Design
- Salary Structure Strategies
- Salary Structure Types
- Salary Survey – Annual
- Salary Survey – Crowdsourced
- Salary Survey – Evergreen
- Sales Compensation
- Sales Compensation – Clawback
- Sales Compensation – Leverage
- Sales Compensation – Pay Mix
- Sales Compensation – SPIFF or SPIF
- Shift Differential
- Standard Deviation
- Standard Error
- Step Rate
- Stock Options
- Total Rewards Statement
- Traditional Graded Salary Structure
- Transparency
- Turnover
- Weighting Survey Data
- Years of Service
ERI Economic Research Institute compiles the most robust salary, cost-of-living, compensation terms and executive compensation data available, with current market data for more than 1,000 industry sectors using the best salary survey data around.
ERI’s Assessor Series® – Solutions for every compensation decision