So the annual pay increase surveys are out, predicting average raises of about 3% – pretty much the same as in the past several years. How helpful is this average when considering pay levels for a specific organization? While it might be simple to just add a percentage increase to all current salaries, that approach is not the way to maximize the effectiveness of payroll dollars, particularly in the nonprofit sector.
Compensation Philosophy Is Key
Especially for nonprofits, defining a compensation approach is important – the salaries for executives are public information (reported on the IRS Form 990 every year), and there are many stakeholders who take an interest. Setting pay close to what other similar organizations pay for similar work not only fulfills the IRS and state charity regulators’ requirements, but also provides a basis for responding to questions from the media, funders, clients, and charity watch groups.
But that is not the only reason to do research on market compensation. If market compensation levels are in place for an organization, then candidates will more likely be attracted to apply for vacant positions and stay with the organization. Paying less than what the job is worth typically leads to difficulty hiring and retaining the talent needed. On the other hand, paying too much means that valuable and limited charity resources could be more effectively used.
Using Data from Comparable Organizations for Executives
The process is all about determining what is comparable. Research has shown that the most influential factors in determining executive compensation are “size” and “industry.” In the nonprofit world, the “size” factor is revenue reported on the Form 990, filed annually by all tax-exempt organizations with the IRS; the “industry,” is subsector, as indicated by a National Taxonomy of Exempt Entities (NTEE) code, the nonprofit classification system created by nonprofit experts and practitioners.
ERI’s Nonprofit Comparables Assessor (CA) provides easy access to the Form 990 compensation data, allows the user to see how similar organizations pay their executives, and calculates reasonable compensation for an organization based on a specific type, size, and location.
CA asks the user to select a specific type of nonprofit, a revenue or asset size, and a geographic location (all US, one state, or selected states or even ZIP codes) and then calculates what expected pay would be for the job in such an organization. For example, the table below shows the expected direct compensation for the CEO of an arts organization with $10 million in annual revenue in New York, with CA using data reported in the Forms 990 of organizations meeting the selection criteria.
Reportable Compensation for CEO of Arts Organizations in New York
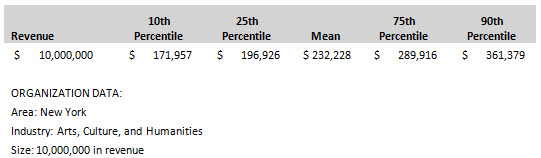
Sample from ERI’s Nonprofit Comparables Assessor™
So, if the CEO compensation in this arts organization is paid around or less than $230,000, there will probably be few questions about reasonable compensation from those reviewing the compensation levels. However, if the pay is much higher, perhaps more than $290,000, additional data and a description of the rationale for paying at the higher-than-expected level might be needed.
Next, a review of more detailed data of very similar arts organizations, perhaps 10 to 15 should be done. ERI’s CA easily generates a list of all organizations that meet the selected criteria, and then the user can select the closest in size, geography, and mission. For example, the table below shows five arts organizations with revenues of about $10 million in New York State, with CEO salaries ranging from $118,000 to $254,000.
Comparable Peer Analysis Table – Partial List
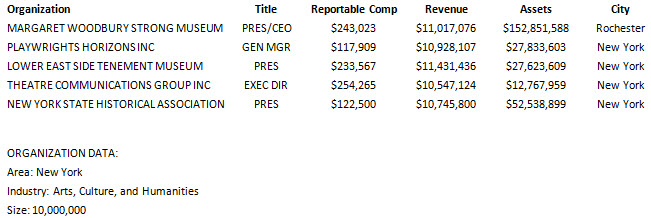
Sample from ERI’s Nonprofit Comparables Assessor™
Obviously there are big differences in what organizations similar in type, revenue size, and location pay their top executives. The search could then be narrowed to a more specific type of arts organization, such as theater versus art museums or a smaller geographic area, such as New York City or Rochester versus the entire state. Another factor to consider for an art organization might be asset size, as the table shows a huge range of assets for this partial list of comparables. Because of the range of pay shown above, it is necessary to show why some are more relevant than other when determining which organizations are comparable.
ERI’s Form 990 library gives access to all Forms 990 so the source document can be used to learn more about organization functions and compensation details.
Finding Comparable Data for Jobs Not Reported on the Form 990
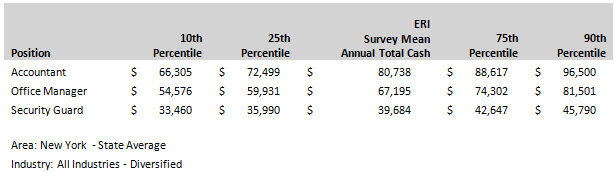
So the executive compensation data are available, using the CA to access Form 990 data. What about wage data for non-executive jobs, such as office manager, the accountant, and the security guard? The market pay for jobs such as these is influenced more by job duties and years of experience than by whether the employer is a nonprofit, a for-profit company, or a government. Often, the skills and experience required are transferable among the three sectors. The size of the organization, whatever its type, also has less influence on salary levels.
ERI’s Salary Assessor (SA) provides market rates for these staff-level positions. Subscribers can access salary data for 7,000 positions (data are from all types of employers) in over 9,000 locations in the US, Canada, and Europe. The user can select a geographic area and industry and then quickly create a list of competitive rates based on data for these staff jobs from all types of employers. Setting pay based on market levels helps to reduce costly turnover and provide comparable information for an organization during salary negotiations. SA can provide information for a smaller geographic area (e.g., New York City, Rochester, etc.) and also list detailed pay differences based on years of experience.
Benchmark Listing of Positions – Annual Pay Average in New York State
All Compensation Decisions Based on Comparable Data
Although the idea of simply applying an across-the-board increase to current compensation levels is appealing, it won’t meet the federal and state regulations on setting pay in the nonprofit sector. Charity regulators could allow big increases but they require data to support that the compensation level as fair and reasonable and comparable. Market-based compensation decisions are required for nonprofit organizations when executive compensation is set – the same type of research is also needed for the nonexecutive jobs so that all employees are compensated like employees in similar situations. Check out ERI’s Nonprofit Comparables Assessor and Salary Assessor to see how easy it can be to benchmark and document compensation for all types of jobs in nonprofits.