Williston, North Dakota, has been the center of the oil boom associated with the Bakken Shale formation for a number of years. Tracking the change in employment of this town provides an interesting study in the timing and development of the boom and may give us some insight into near-term employment changes given the recent drop in oil prices.
The number of employed persons in January of 2010 was 15,000 and, as of December 2014, there were about 40,000 employed persons in Williams County, North Dakota (per BLS LAUS data) – see Figure 1. Looking at the monthly numbers, the rate of increase was fairly constant with the addition of just over 700 jobs per month for 32 months. However, in the summer of 2012, the employment pattern changed completely. The rate dropped to an average of 131 additional net jobs per month. A clear seasonal pattern emerges as employment dropped during the winter and rebounded with that small net increase in the summer. The green trend line in Figure 1 helps to highlight this shift.
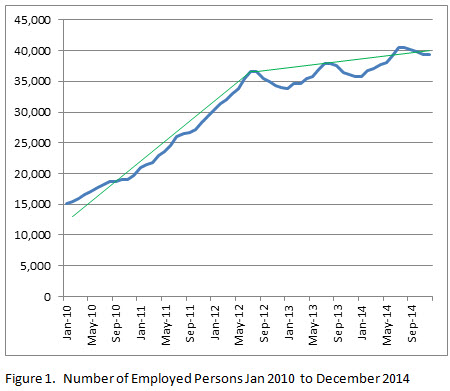
Clearly Williston did not have the initial labor market to support a sudden increase in oil field exploration and development and quickly added employed persons. The employment numbers suggest that the increase in development slowed in early 2012 and shifted to seasonal with ongoing production work holding steady.
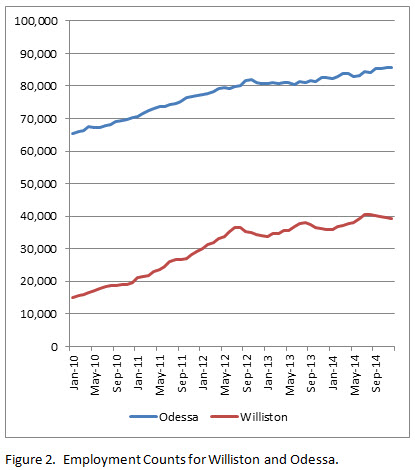
This pattern may lead one to wonder if it is unique to North Dakota; that is, did the recent discovery and development of this particular field drive the employment patterns we are observing? To look at this more closely, consider Odessa, Texas, another area experiencing an oil boom in a different part of the country. Figure 2 shows a similar pattern and timing of increase and subsequent flattening of the employment rate in Odessa as compared to Williston. Odessa, being in Texas, doesn’t show the seasonality that Williston does and Odessa was a larger city to begin with, so the percentage of increase is not as large. But the overall patterns are very similar.
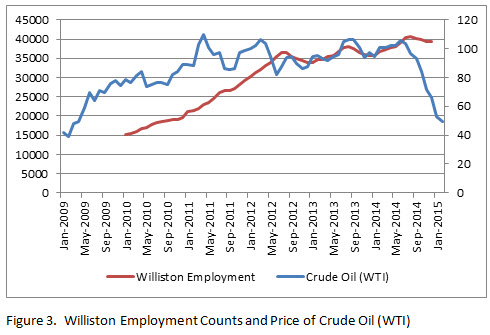
This suggests that it was not a factor unique to Williston that is driving the pattern, but an effect of the overall oil market itself. To look at this in more detail, the employment numbers for Williston were overlaid with the price of a barrel of crude oil (WTI) including the prior year and four latest months. It is beyond the scope of this analysis to investigate this relationship in detail; however, the graph shows that, once the price hits between $70 and $80/barrel, the employment numbers start the initial increase and, as oil continues up over $100/barrel, the rate continues with no seasonality. Then, as the oil price increases slow, the employment rates in Williston flatten and take on the seasonal pattern about six months later.
While this is only an initial analysis of the oil boom phenomena, we can conclude that there is a relationship between the price of oil crossing about $70/barrel and employment pattern changes in the oil-driven economies of Williston and, to some extent, Odessa. Currently the price at less than $70 is back to where it was nearly 6 years ago (before the boom), and all current indicators suggest it will stay below that level for at least the near term (update: the price is down to $50.96/barrel as of February 10, 2015). The question the graph cannot address at this time is where do the employment numbers go from here? We will be keeping an eye on these numbers to update as data become available.