This learning aid serves as a resource to select and to use compensation surveys, a foundational element in total rewards management.
Why Use Compensation Surveys?
Compensation surveys are an essential tool for organizations to measure the external labor market. If not developed ‘in-house,’ pay-information surveys conducted elsewhere can be obtained, though participating in a survey may be required.
Given the usage and importance of compensation surveys, the following questions should be addressed when evaluating a survey:
- What jobs are included?
- What markets and organizations are covered in the survey?
- What type of information is collected?
The Market Rate
Employees typically expect to be paid the normal market rate for comparable work, especially as access to online compensation data sources becomes more widespread. Increasing employee engagement over labor market norms makes it more important than ever for Human Resources professionals to be well-versed in compensation survey data.
Organizations determine competitive “market rates” for a job based on the following parameters:
- Cross-industry geographic area
- Targeted industry rates within a geographic area
- Industry rates not considering geographic area
Available Sources
Organizations that need competitive market data have several options, listed from least expensive to most expensive:
- U.S. government surveys
- Free online salary websites
- Compensation surveys from specialty firms
- Sources providing a census based on wage-survey sources
- Professional survey or trade association surveys
- Informal group of employers participating in a survey
- Sponsor a new survey
Relevant Information
Compensation surveys require a significant quantity of organization-level data for companies to target relevant peers and labor markets, including information concerning these elements:
- Size (often revenue or number of employees)
- Location
- Industry
Comprehensive compensation surveys also require pay-policy information and pay-practice information, allowing for contextual interpretation of compensation data, including the following:
- General increases
- Salary structure adjustment
- Merit increase and promotion or adjustment budgets
- Number of incumbents in each job
- Extremes of the salary range
- Degree of match
- Actual low salary
- Actual high salary
- Hiring rate
- Incentive or bonus eligibility
- Premiums
- Shift differentials
- Union status
- Exemption status
- Education level typically required for the position
- Certifications typically required
Job Matching and Comparability
The major concern when comparing compensation surveys is whether the job titles and their matching descriptions surveyed adequately mirror each other. Key positions included in surveys, known as benchmark jobs, should meet these requirements:
- Represent the entirety of relevant jobs
- Exist in the majority of surveyed firms
- Be readily definable
- Have similar descriptions to one another
- Represent quality reference points (concerning difficulty and responsibility) within the job structure
- Be widely recognized within the Human Resources community
- Be positions that at least some organization fill using external sources
Position comparability depends upon the “job match” between benchmark job descriptions used for a survey and an analyst’s knowledge of a similar position’s tasks within his or her organization. As a best-practice guideline, if 70% of the core responsibilities reflected in the job descriptions match, then the two jobs can be considered a match. This entails a position analysis through comparison between a survey participant’s compensation professional and the survey consulting firm, especially for first-time survey participants. Proactively communicate to internal staff who contribute to the job matching process that benchmark job descriptions tend to be more generic, less detailed descriptions than ‘in-house.’
Analyzing Data
Although the process of collecting data through compensation surveys is well-defined, the data analysis can be conducted and/or displayed in a variety of manners. The first step in analysis is to determine standard error (usually expressed in percentages or in currency amounts), which is the standard deviation of a sampling distribution and measures the reliability of the survey results based on the spread. Once the standard deviation is known, confidence intervals can also be defined. (Explanation of the calculations is outside the scope of this document.)
Then, survey results should be summarized in an easily understandable format, such as a graph showing maturity curves or other data visualization approaches that effectively present the information to the targeted audience. The maturity curves represent progress in an occupation and are typically used in salary surveys of professional employees, as shown below:
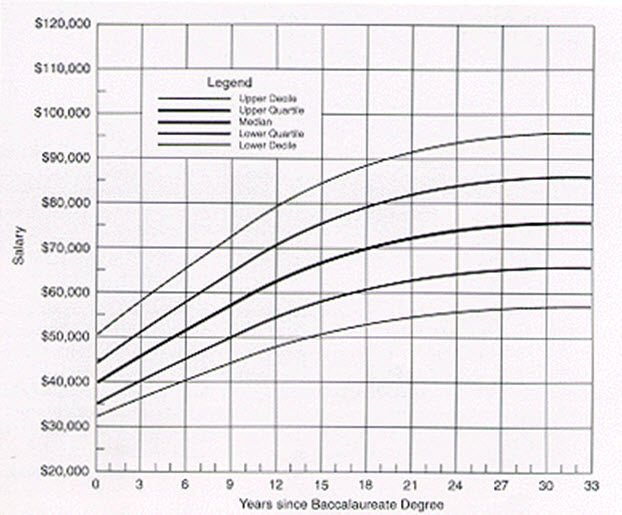
Professional associations often collect and publish compensation survey results by discipline, degree level, supervisory status, and years since degree. Separate distributions are provided for different degree levels and for supervisors and non-supervisors.
Safe Harbor
In August of 1996, the Department of Justice and the Federal Trade Commission issued Statements of Antitrust Enforcement Policy in which both agencies established basic guidelines ensuring survey constructs do not violate antitrust law (preventing collusion). In response, Safe Harbor guidelines were adopted by many companies, as surveys conducted within Safe Harbor usually are not challenged by the Department of Justice or Federal Trade Commission.
The guidelines, known as the Antitrust Safety Zone, specify the following:
- A survey must be conducted/managed by a third party
- Data provided by survey participants must be older than three months
- At least five organizations must report data for each disseminated statistic
- No single data source will represent more than 25% of the weighted basis of the statistic
- Reporting must be aggregated to prevent identification
Conclusion
Identifying, selecting, and analyzing relevant compensation benchmark data requires a diligent process, providing competitive market data for relevant industries, similar jobs, and appropriate labor markets. This learning aid has outlined such an approach.
ERI Economic Research Institute compiles the most robust salary, cost-of-living, and executive compensation survey data available, with current market data for more than 1,000 industry sectors.
ERI’s Assessor Series® – Solutions for every compensation decision