So how much does the executive director of “Poodles in Peril” or “Save Cripple Creek from the Developers” earn each year? How much should he or she make? While these are imaginary organizations, groups with similar names asking for donations seem to be everywhere – in the daily mail, highway billboards, television, and print media. The appeals are numerous, and the accompanying pictures and prose are dramatic and engaging, but how do these types of organizations (categorized as “environment/animal” in the National Taxonomy of Exempt Entities, the classification system used in the nonprofit sector) fit into the nonprofit sector? How much do their executives make compared to similar-sized nonprofits providing other types of services?
While there are close to 1.6 million nonprofit organizations registered with the Internal Revenue Service in the United States, only about 40% of them have revenues reaching the level of $50,000 that requires the filing of an annual Form 990 (with the exception of private foundations, which must file a Form 990-PF regardless of revenue or asset size). Public charities (tax-exempt organizations to which donors can make tax-deductible donations) are a subset of the more than 30 types of tax-exempt organizations and comprise about 80% of the total.
The number of reporting public charities – meeting the revenue requirement for filing a Form 990 – is about 300,000 each year. About 35% are involved in human services, while the second largest category is education organizations (almost 18%), followed by health organizations (12%).
Trailing in both numbers and size are environmental/animal public charities. There are about 15,000 of them nationwide, but annual revenues total about $15 billion, less than 1% of the total revenues in the nonprofit sector. While the number of groups has increased over 50% over the past ten years, they still represent less than 5% of the total of public charities and hold less than 1% of the assets in the sector. See more on the composition of the sector in the annual report prepared by the National Center for Charitable Statistics at the Urban Institute.
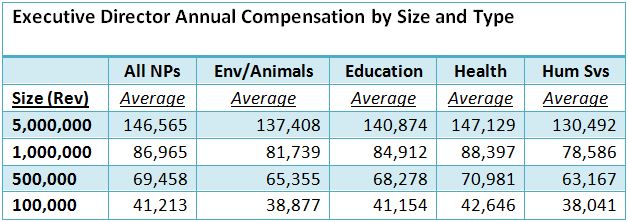
When compared to other types of nonprofits, environmental/animal groups tend to pay their executive directors (EDs) on the low side, according to the analysis of Form 990 compensation data from ERI’s Nonprofit Comparables Assessor. The table below shows the relevant comparisons.
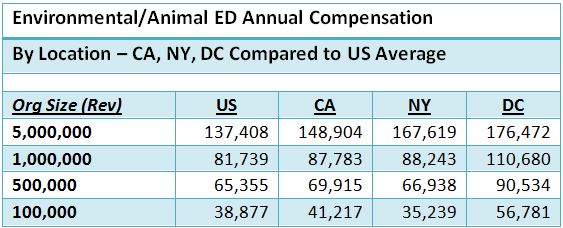
Along with size and type of services provided, another factor that impacts salary levels for EDs is geographic location. First, annual salaries for EDs of similar-sized environmental/animal organizations are compared for different locations where many might be expected to be located. Overall, the ED salaries of organizations in these large states and in Washington, DC (perhaps attempting to influence national policy and legislation) are higher than the average salaries throughout the US.
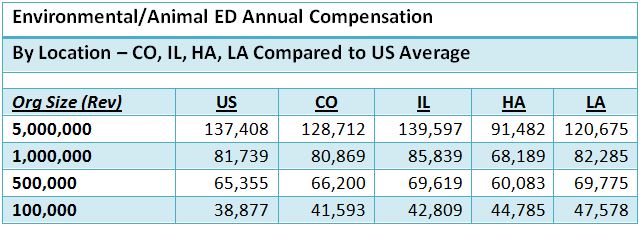
The table below shows salaries in some other geographic locations – and it is significant but variable.
The bottom line – the IRS regulations require that public charities look at compensation data from similar organizations (typically defined as similar in type of service provided, size, geographic location) in the process of setting executive salary levels. These factors all have significant impacts on what nonprofit executives are paid, as demonstrated above for environmental/animal organizations.