From a business leadership perspective, evaluating performance at the individual or organization level can usually be expressed as “exceeds expectation,” “meets expectations,” and “does not meet expectations.” These performance standards become more meaningful when they are evaluated relative to a peer group, potentially eliminating “rater bias” and allowing better allocation of compensation dollars as well as other human capital investments.
For executive employees, their peer groups and relative performance are anchored to external benchmarks. What is meant by this? For example, in Suburban Propane’s latest Proxy, the company disclosed a peer list of 11 companies and defined their comparability based on the business (i.e. publicly-traded propane marketing partnerships) and tax structure:
- AmeriGas Partners, L.P.
- Copano Energy, LLC
- Dorchester Minerals, L.P.
- Enbridge Energy Partners, L.P.
- Energy Transfer Partners, L.P.
- Ferrellgas Partners, L.P.
- Global Partners, L.P.
- Inergy, L.P.
- MarkWest Energy Partners, L.P.
- Plains All American Pipeline, L.P.
- Sunoco Logistics Partners, L.P.
Companies competing in volatile industries that are impacted by macro-economic factors and global events need to evaluate their peer list on a frequent basis and conduct comprehensive analysis to develop a thoughtful business rationale for any peers that may be added or removed. To identify the relevant peer group, companies first define peers in terms of markets in which they compete for products/services and talent. Then, they critically review this list by determining the similarities and differences between them, analyzing the financial performance of these organizations, and evaluating any strategic business intelligence they have about them.
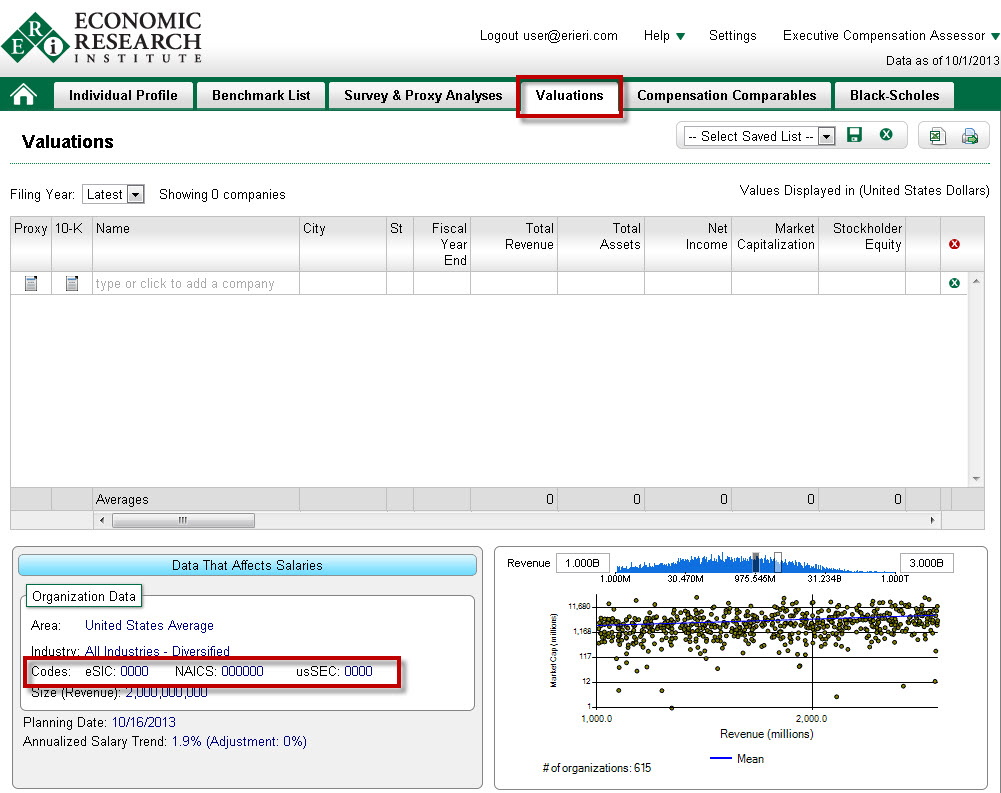
ERI’s Executive Compensation Assessor enables companies to easily create a peer group in order to review the financial performance of companies by downloading into a spreadsheet over 50 financial data elements. To generate a peer list of companies, ERI subscriber define criteria based on industry and revenue size as depicted in the below story board/ screenshots:
From the Valuations tab, click on the industry code field:
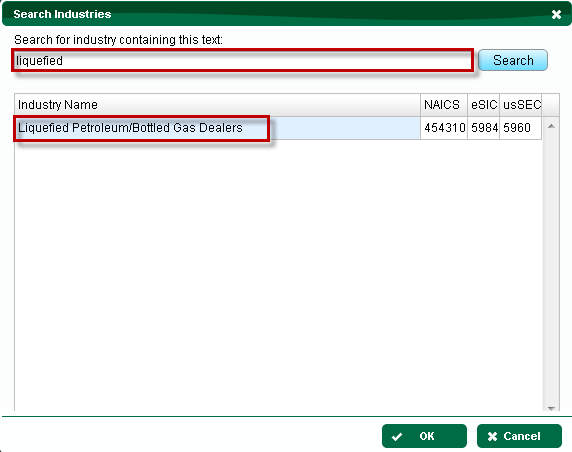
Within a few clicks a Search Industry box will appear and using the industry search text feature the user enters the description, the industry criteria can be selected for the peer list. Continuing with the Suburban Propane example, Liquefied Petroleum/Bottled Gas Dealers is the industry that is selected.
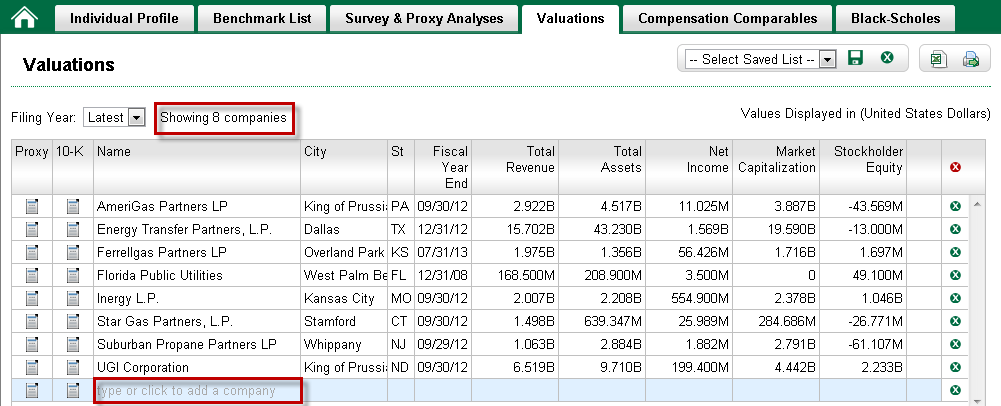
Then we expand the revenue range to get the entire population of companies in the output given this is a niche industry and Suburban did not use revenue size in the description of their business rationales for the Peer List as disclosed in their Proxy.

A preliminary peer list with 8 companies is displayed based on the Industry Criteria. To further customize the list, the user can add companies by clicking on the last “blank” row in the table.
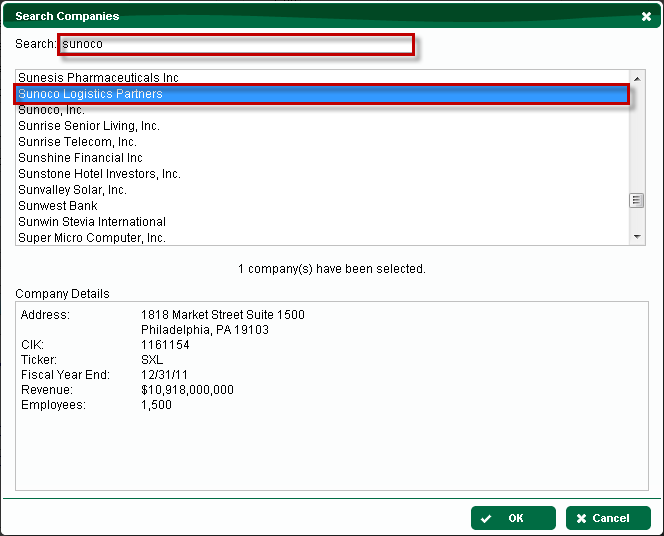
A Search Companies box will display and the user can enter the company name, select from this results and continue to add specific companies until the list is complete.
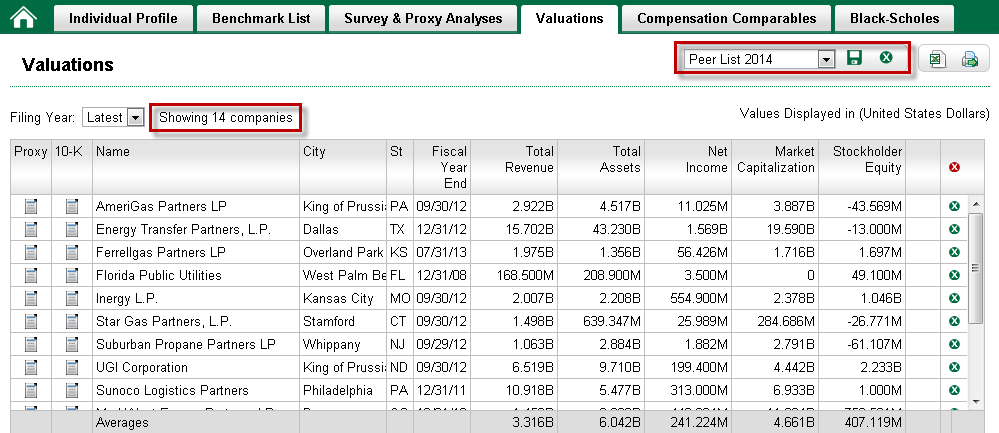
The final results include 14 companies (3 more than last year) for Suburban Propane to evaluate. Now the user can save the list for future reference, output the results into an MS Excel spreadsheet and conduct any further analysis on over 50 data elements.
To measure performance and ensure relative peer comparisons are relevant, companies invest a lot of time and resources in internal controls to establish processes for these purposes. ERI’s Executive Compensation Assessor can help companies in meeting their data requirements in this regard. For more information, contact ERI at 1-800-627-3697 or visit www.erieri.com.